Search
Thursday
Oct222020

Not Just Faxes

By Kim Bellard, October 21, 2020

I missed it when it was first announced in Japan, but fortunately the U.S. mainstream media has finally picked up on the story, with articles in both The Washington Post and The Wall Street Journal: Japan’s new Administrative Reform Minister Taro Kono has “declared war” on fax machines, among other paper-based traditions.

Wait, what? “Administrative Reform Minister?” The U.S., or at least the U.S. healthcare system, has to hear about this.

Mr. Kono set up a hotline for people to report government red tape, which was quickly overwhelmed with thousands of examples. It soon reopened.

It didn’t take long for Mr. Kono to start calling for significant changes. “To be honest, I don’t think there are many administrative procedures that actually need printing out paper and faxing,” he said in a press conference in late September. “

Part of the problem in Japan is the hanko, a personal stamp that is routinely used for authentication (and which thus requires paper.)

If you’ve ever envied Japan for its bullet trains, its early adoption of robots, or its broad use of consumer electronics, you may be surprised to hear that more than 95% of Japanese businesses still use faxes, and 34% of Japanese households have a fax. Mr. Kawaguchi admitted: “It may be 1970s technology, but it is extremely secure and very difficult for someone on the outside to hack…Digitisation may make things more efficient, but there is clearly a trade-off when it comes to security.”

Not surprisingly, the COVID-19 pandemic has been a big driver in the anti-fax initiative. Health care professionals were overwhelmed by the amount of reports that had to be prepared by hand and then faxed. “Come on, let’s stop this already,” one physician tweeted. “Even with corona, we’re handwriting and faxing.” Mr. Kono quickly retweeted it, even though he was still in his former position as Defense Minister — and within a week the health ministry announced a system of online filing (which, not surprisingly, has not entirely succeeded).

An independent report on Japan’s response to the pandemic found that their system “made it difficult to grasp the spread of infection in real time nationwide, and exhausted health center staff. The new coronavirus crisis was also Japan’s ‘digital defeat.’”

We don’t have hankos in the U.S., and we’re not as reliant on faxes as Japan is, even in our healthcare system. But red tape, inefficiencies, and antiquated technology? Yeah, we’ve got all that, especially in healthcare. But where’s our Secretary of Administrative Reform? Where are our Chief Administrative Reform Officers?

Heck, where are our hotlines to report red tape?

Even now, well over six months into our pandemic response, we have a slapdash, state-by-state (or even county-by-county) system of reporting, with hospitals and HHS still struggling to figure out what and how to report.

Yoshimitsu Kobayashi, chairman of Mitsubishi Chemical Holdings, sees the pandemic as an opportunity: “The very negative damage it has inflicted on Japan has in turn served as a powerful accelerator. If we miss this chance, we won’t be able to do it next time.”

Economist Paul Romer is usually credited with the quote, “A crisis is a terrible thing to waste.” Well, we certainly have a crisis, and I’m worried we’re going to waste it. Using it to just get rid of faxes would be a waste. We’re already using it to streamline development of therapeutics and vaccines, although not without problems. But will we use it to solve fundamental problems in our healthcare system, such as inequities, inefficiencies, and infrastructure?

Maybe we could recruit Mr. Kono to do the job.


This post is an abridged version of the original posting in Medium. Please follow Kim on Medium and on Twitter (@kimbbellard)

Monday
Oct122020

Management and Rehabilitation of Long-Term Effects of COVID-19

By Dr. Seleem R. Choudhury, October 12, 2020

As a society, we have been enduring life in a pandemic for over half a year. Though we have been feeling the effects of COVID-19 for a long time, medically speaking the disease is still very new to us. It is important to remember that our knowledge is still developing regarding the virus and much remains unknown—specifically the long-term effects of the disease.

There is a common misconception that once a patient infected with COVID has a negative test, the issue is resolved.  It is often repeated that according to the World Health Organization, about 80% of COVID-19 infections are mild or asymptomatic, and patients typically recover after two weeks (Carfì, Bernabei, & Landi, 2020). 

Yet there are tens of thousands of people who have joined support groups on Slack and Facebook, who call themselves “long-termers” or “long-haulers” who are wrestling with serious COVID-19 symptoms a month or more after being infected with the disease (Yong, 2020). 

There are essentially two types of COVID patients experiencing who appear to be experiencing long-term effects of the virus—those who were ventilated due to critical symptoms and those who have residual symptoms despite having “mild” symptoms while infected with the disease (Liu, Yan, Wan, Xiang, Le, & Liu, 2020).

Critical care teams know that the longer patients remain in the intensive care unit (ICU), the more likely they are to suffer “long-term physical, cognitive and emotional effects of being sedated” (Edwards, 2020). In fact, those effects have a name: "post-intensive care syndrome (PICS)," also referred to as post-ICU delirium. PICS is an ongoing challenge even in non-pandemic conditions. An article in 2019 described PICS resulting in cognitive impairment in 30–80% of ICU survivors, the severity may vary and often lasts for years (Colbenson, Johnson, & Wilson, 2019).

As a hypothesis based upon 2019 post-ICU delirium numbers together with an increased number of patients on ventilators due to COVID, and then combined with non-hospitalized virus survivors who are experiencing long-term symptoms, our current circumstances potentially present a public health crisis (Vittori, Lerman, Cascella, Gomez-Morad, Marchetti, Marinangeli, & Picardo, 2020).  This presents hospitals, community practices, and mental health support agencies with an opportunity to expand their care services to meet a growing—and likely lasting—need.

Long-term effects of COVID-19

Four-fifths of those diagnosed with COVID experience mild symptoms.  A “mild” case is defined as two weeks or more of symptoms such as fever, cough, sore throat, malaise, and myalgias.  Beyond these flu-like symptoms, some patients have gastrointestinal issues, including anorexia, nausea, and diarrhea (Gandhi, Lynch, & del Rio, 2020). 

But experts are finding that patients who had mild symptoms can experience more than just a decline in physical health. Between 30% and 50% of people infected with COVID that have clinical manifestations will face some form of mental health issues, according to an estimate from Dr. Teodor Postolache, a professor of psychiatry at the University of Maryland School of Medicine (Goldberg, 2020; Advisory Board, 2020).  Those affected may experience anxiety or depression but also “nonspecific symptoms that include fatigue, sleep, and waking abnormalities, a general sense of not being at your best, not being fully recovered in terms of the abilities of performing academically, occupationally, [and] potentially physically” (Cooney, 2020).

Anecdotally, this matches what healthcare professionals are hearing from “long-haulers.” In addition to widely-reported fatigue reported by those healing post-COVID, these patients are experiencing neuropsychological problems ranging from headache, dizziness, and lingering loss of smell or taste to mood disorders and deeper cognitive impairment. Early reports from clinicians in China and Europe describe those infected with the disease suffering from lingering depression and anxiety, and in some cases muscle weakness and nerve damage preventing the ability to walk (Cooney, 2020).

Some COVID patients experiencing critical symptoms such as difficulty breathing were admitted to an Intensive Care Unit and placed on a ventilator.  On average in the U.S., approximately 0.8 million people every year receive this treatment in critical care; it can be reasonably assumed that this number will drastically increase in 2020 with the spread of COVID (Jaffri, 2020).

There are years of substantial data indicating that people requiring mechanical ventilation experience adverse effects after they are discharged from care (Wunsch, Linde-Zwirble, Angus, Hartman, Milbrandt, & Kahn, 2010).  People who survive up to two years after discharge from critical care are readmitted to nursing care, a rehabilitation facility, or to an ICU at up to a rate of 80%. Patients who have similarities to morbidities and the acute respiratory distress experienced by COVID-19 survivors are readmitted into these types of care at a higher rate (Jaffri, 2020). 

Additionally, a study published by the American Thoracic Society found that other issues such as physical impairment, physical deconditioning, and muscle weakness can affect those who required mechanical ventilation for up to a year after their removal from the ventilator (Ruhl, Lord, Panek, Colantuoni, Sepulveda, & Chong, 2014). Some also report difficulties returning to work or maintaining financial stability.  According to a 2018 study, 33% of individuals placed on a ventilator are unable to drive, limiting their mobility and social responsibilities, even up to a year after being discharged from critical care (Ohtake, Lee, Scott, Hinman, & Ali, 2018).

Solutions and opportunities

There is growing consensus that COVID-19 has potentially serious long-term physical and mental effects for survivors, regardless of whether symptoms at the time of infection were mild or critical.  Simple analytics should be able to ascertain the need. This review is important as It is the responsibility and opportunity of the healthcare community to respond to this potential health crisis within its community. 

The European Respiratory Society and American Thoracic Society-coordinated International Task Force recommends that clinicians follow up with all COVID-19 patients who were hospitalized because of the infection 6 to 8 weeks after their discharge from care (Spruit, Holland, Singh, Tonia, Wilson, & Troosters, 2020).

In response, COVID-19 rehabilitation clinics are being formed to focus on assessing patients’ cognitive ability, mental health, mobility, and ability to perform daily activities. These clinics offer mental health, physical therapy, and occupational therapy services, as well as pediatric rehabilitation medicine to address the needs of those dealing with long-term effects of the virus (Spruit, Holland, Singh, Tonia, Wilson, & Troosters, 2020).

The Spaulding Rehabilitation Network has engaged a multidisciplinary physician-led team of physiatrists, physical therapists, occupational therapists, speech language pathologists, and case managers to establish a dedicated outpatient clinic for those who are recovering or were hospitalized for COVID-19.  The Kennedy Krieger Institute is introducing a rehabilitation clinic for those children and adolescents under age 21 who have “recovered from the virus but need additional support to regain lost neurological and physical function as a result of the illness.”  The Shirley Ryan Ability Lab has been offering rehabilitation services for decades, and has already opened their services to those dealing with impairments as a result of COVID-19.

“Long-haulers” are experiencing the effects of a debilitating illness, and it will be vitally important for them to receive rehabilitation care, whether in person or via telehealth, to return to full health and quality of life (Urban, 2020).  As was stated in the European Respiratory Journal: “Considering the expected high burden of respiratory, physical and psychological impairment following the acute phase of COVID-19, a huge number of patients should be referred early to a rehabilitation program” (Polastri, Nava, Clini, Vitacca, & Gosselink, 2020).

Early data from health authorities in the United Kingdom and Italy, two countries hit hard with COVID-19, has shown that a structured rehabilitation program in-clinic, in the home, or virtually can mitigate post-ICU symptoms for those treated for COVID-19, thus resulting in improvements in daily function and independence. This success can also be extended to those with milder symptoms and reduce alienation that victims of the disease have reported experiencing, and ensure physical, emotional and cognitive functioning and recovery.

In the U.S. hospitals have been so focused on the present crisis, that they have not developed the capacity to deal with patients and their post-COVID needs. This could create a potential health crisis down the road. It is time to transition out of crisis-mode and begin to form a strategy to serve the needs of patients who are experiencing long-term effects of COVID-19.

Resources:

Read more from Dr. Seleem Choudhury at seleemchoudhury.com.

Thursday
Oct082020

15 Things to Know From Three New TeleHealth Studies

by Clive Riddle, October 8, 2020

July results from Fair Health's Monthly Telehealth Regional Tracker tells us that telehealth use continues to increase significantly during this COVID -19 year compared to last year, use has decreased somewhat from the previous month, and mental health conditions continue to be the number one telehealth diagnosis. The data represent the privately insured population, excluding Medicare and Medicaid. Launched in May as a free service, the Monthly Telehealth Regional Tracker uses FAIR Health data to track how telehealth is evolving from month to month.

Here's four things to know from their just released July data:

  1. Telehealth claim lines (an individual service or procedure listed on an insurance claim) increased 3,806 percent nationally from July 2019 to July 2020, rising from 0.15 percent of medical claim lines in July 2019 to 6.00 percent in July 2020
  2. While increasing greatly from 2019 to 2020, telehealth claim lines fell 12 percent nationally on a month-to-month basis, from 6.85 percent of medical claim lines in June 2020 to 6.00 percent in July 2020.
  3. In July, mental health conditions continued to be the number one telehealth diagnosis nationally and in every region, as they had been since March 2020. Nationally, mental health conditions represented 45 percent of telehealth claim lines in July 2020, compared to 37 percent in July 2019.
  4. Trends in the four US census regions (Midwest, Northeast, South and West) were similar to those in the nation as a whole. The Northeast had the greatest percent increase in volume of any region from July 2019 to July 2020: 8,987 percent. From June to July 2020, it also had the greatest percent decrease: 16 percent.

Last week J.D. Power released findings from its 2020 U.S. Telehealth Satisfaction Study, their second annual examination of patient satisfaction with telehealth services, measuring consumer telehealth service experience based on four factors (in order of importance): customer service (42%); consultation (28%); enrollment (19%); and billing and payment (11%). Here’s six things to know from their findings:

  1. The overall customer satisfaction score for telehealth services is 860 (on a 1,000-point scale), which is among the highest of all healthcare, insurance and financial services industry studies conducted by J.D. Power.
  2. 52% of telehealth users say they encountered at least one barrier that made it difficult to use telehealth. The most common hurdles are limited services (24%); confusing technology requirements (17%); and lack of awareness of cost (15%). Additionally, 35% of telehealth users indicate they experienced a problem during a visit. Tech audio issues (26%) are the most common problem.
  3. Overall satisfaction is 117 points lower among patients with the lowest self-reported health status than among patients who consider themselves to be in excellent health.
  4. Among patients who used a telehealth offering this year, 46% say their top reason for choosing telehealth was safety. That compares with just 13% in 2019.
  5. Cigna ranks highest among payers of health plan-provided telehealth services with a score of 874. Kaiser Foundation Health Plan (867) ranks second and UnitedHealthcare (865) ranks third.
  6. Amwell ranks highest in telehealth satisfaction among direct-to-consumer brands, with a score of 885. Doctor on Demand (879) ranks second.

Speaking of Amwell, they have just released findings from their 2020 Physician and Consumer Survey. Here’s five telehealth things to know from their study:

  1. The shift toward scheduled visits and specialty care is one of the most pronounced trends in telehealth usage during COVID-19. During the pandemic, patients were far more likely to use telehealth for scheduled visits, especially with providers they already knew. Just 21% of consumers who reported having a virtual visit had an on-demand urgent care visit in 2020. By contrast, 54% had a scheduled visit with their primary care physician.
  2. In 2020, 42% of consumers who reported having a virtual visit had a scheduled visit with a specialist they already knew, and another 13% had a virtual visit with a new specialist.
  3. The number of consumers who’ve had a virtual visit has nearly tripled since last year. What’s more, 59% of consumers who’ve had a video visit had their first one during the pandemic, and 91% of patients reported being “very” or “somewhat” satisfied with the visit.
  4. Among providers, the percentage of those who have used telehealth nearly quadrupled since last year, and 84% said they were “very” or “somewhat” satisfied with one or more telehealth platforms. 96% of physicians said they were willing to use telehealth, with a sizable majority saying they’d be willing to use it for prescription renewals (94%), regular chronic care management check-ins (93%), and follow-up visits after surgery or hospital stays (71%).
  5. During COVID-19, physicians most frequently cited technology challenges as a barrier to telehealth adoption at their organization (72%), followed by uncertainty around reimbursement (64%) and questions about clinical appropriateness (58%).
Wednesday
Sep302020

SDOH’s Cube - Compliments of Peter Kongstvedt

By Clive Riddle, September 30, 2020

Dr. Peter Kongstvedt over a decade ago, before Social Determinants of Health rose to more recent prominence, developed an illustration of how complex and intertwined the multitude of determinants are that impact a consumers' state of health, using the famous Rubik's Cube design as model.

Peter Kongstvedt, MD, FACP is a highly regarded national authority on the health care industry with particular expertise in health insurance and managed health care, and was recently emailing with me on the topic of SDoH, and shared his graphic from the past that he told me he'd "created many, many years ago in my attempts to increase awareness of the issue, though it wasn’t called SDoH then, so I grafted that on to the slide – just for you."

I was so taken with how applicable his blast from the past was for Social Determinants of Health, that I asked for his permission to share the illustration with you, so here you go - and think about applying other current determinant items as well that are being discussed in the world of SDoH, and how complex the variables are for any individual outcome - and you'll see the Rubik's challenge in front of those on the front lines of SDoH.

Wednesday
Sep232020

WeChat to Many, But WeDoctor to Some

By Kim Bellard, September 23, 2020


You’ve probably heard about TikTok, especially lately. But you may have paid less attention to what’s been going on with WeChat, another China-based app. WeChat was part of the original proposed ban, which a federal judge blocked this weekend, hours before it was due to go into effect (the Commerce Department plans to appeal). The ban is on “transactions,” which, in WeChat’s case, covers a lot of ground.

WeChat is owned by Tencent Holdings, one of China’s internet giants. It has been described as a “Swiss Army knife” app, able to do many tasks — not just messaging and social networking, but also games, shopping, and payments.

It is also important to users’ health. WeChat is, according to CMI Media, “fast becoming the #1 online healthcare destination in China.” It offers, among other things, health content (some in partnership with U.S. firms), health products, telehealth, a network of “trusted” doctors, a form of health insurance, and WeDoctor. The latter “provides online health enquiry service, psychological support, prevention guidelines and real-time pandemic reports,” and is free to the user. It is available “24/7 for people all over the world.”

If we’re worried about what information China might glean from the video-watching habits of teenagers, think about how worried we should be about China having access to what health information users sought, what medical advice they got, and what health products they ordered.

China is famed for its “Great Firewall,” which restricts which outside internet platforms — like Google or Facebook — can be used within its borders. Equally important, the Chinese government monitors what happens on WeChat and other internet platforms/apps, and does not allow news or opinions it finds objectionable, or subversive.

There are estimated to be 19 million U.S. users, out of WeChat’s 1.2 billion users; most are people with family or friends in China, who rely on the app to stay in touch. The U.S. may argue it is worried about what financial and personal information might be going to the Chinese government, but it should be equally worried about what “information” is being served to U.S. users.

Think, for example, what it might tell U.S. users about COVID-19 vaccines.

The U.S. moves make some worry that we’re becoming more like China, leading to the “splinternet” where, as Vox explained, “your experience of the internet increasingly depends on where you live and the whims of the ruling parties there.”

It is the opposite of the open access, no borders version of the internet that most of us have believed in for the past thirty years. Aaron Levie, CEO of cloud-computing company Box Inc, warned in The Wall Street Journal: “U.S. tech companies have far more to lose if this becomes a precedent. This creates a Balkanization of the internet and the risk of breaking the power of the internet as one platform.”

Somehow, “optimal fragmentation” isn’t how I want to think of my internet experience; I suspect that fragmentation won’t be so optimal.

In discussing the effect of potential WeChat bans with The New York Times, Fang Kecheng, a professor at the Chinese University of Hong Kong, said: “Information is like water. Water quality can be improved, but without any flow, water easily grows fetid.” He didn’t carry the analogy further, but I will: information is like water, in that, eventually, it will get to where it wants to go.

We don’t have a U.S. platform as versatile as WeChat; we don’t even have a health platform as capable as WeChat’s health capabilities. But, if we’re not careful, WeChat might become that platform.

This post is an abridged version of the original posting in Medium. Please follow Kim on Medium and on Twitter (@kimbbellard)

Friday
Sep182020

The Ever-Growing Body of Evidence of Racial Disparities in COVID-19 Prevalence

by Clive Riddle, September 18, 2020

Kaiser Family Foundation has released a new study: COVID-19 Racial Disparities in Testing, Infection, Hospitalization, and Death: Analysis of Epic Patient Data, which adds to the evidence of disparities in COVID prevalence.

KFF reports that "the racial disparities in illness and death are not fully explained by differences in underlying sociodemographic characteristics and health conditions, finds the study, which analyzed Epic electronic health record data for roughly 50 million patients from 53 health systems representing 399 hospitals across 21 states." They conclude that "people of color may face increased barriers to testing that contribute to delays in obtaining testing until they are in more serious condition compared to White patients. They also demonstrate that people of color are bearing a disproportionate burden of negative health outcomes related to the COVID-19 pandemic at every stage."

Although testing rates differed little by race and ethnicity, among those tested, Hispanic patients were over two-and-a-half times more likely to have a positive result comparted to White patients, while Black and Asian patients were nearly twice as likely. COVID-19 infection rates among Hispanic and Black patients were over three and two times higher, respectively, compared to the rate for White patients. Hospitalization rates for Hispanic and Black patients with COVID-19 were more than four times and over three times higher, respectively, compared to the rate for White patients. Death rates for both groups were over twice as high as the rate for White patients.

COVID19 Positive Test Results:

  • Hispanic: 311 per 1,000 tests
  • Black: 219 per 1,000 tests
  • Asian: 220 per 1,000 tests
  • White:113 per 1,000 test

COVID-19 Infection Rates

  • Hispanic: 143 per 10,000 population
  • Black: 107 per 10,000 population
  • White: 46 per 10,000 population

COVID-19 Hospitalization rates

  • Hispanic: 30.4 per 10,000 population
  • Black: 24.6 per 10,000 population
  • White: 7.4 per 10,000 population

COVID-19 Death Rates

  • Hispanic: 5.6 per 10,000 population
  • Black: 5.6 per 10,000 population
  • White: 2.3 per 10,000 population

KFF reminds us that their analysis, a joint project of the Epic Health Research Network and KFF, builds upon the findings of numerous other studies. In fact, just during the past 30 days, some of these studies have included:

The Color of Coronavirus: Covid-19 Deaths By Race and Ethnicity in the U.S.

APM Research Lab, September 16, 2020


Beyond the Case Count: The Wide-Ranging Disparities of COVID-19 in the United States

The Commonwealth Fund, September 10, 2020


'Enough is enough': Gilead-Morehouse study racial, ethnic disparity in COVID-19

S&P Global Market Intelligence, September 8, 2020


Racial/Ethnic Disparities in Hospital Admissions from COVID-19 and Determining the Impact of Neighborhood Deprivation and Primary Language

medRxiv, September 2, 2020


Community-Level Factors Associated With Racial And Ethnic Disparities In COVID-19 Rates In Massachusetts

Health Affairs, August 27, 2020


Racial Disproportionality in Covid Clinical Trials

New England Journal of Medicine, August 27, 2020


Disparities in Incidence of COVID-19 Among Underrepresented Racial/Ethnic Groups in Counties Identified as Hotspots During June 5–18, 2020

CDC Morbidity and Mortality Weekly Report, August 21, 2020

Wednesday
Sep092020

The Impact of Clinical AI: Four Questions for Jvion

By Claire Thayer, September 10, 2020


Recently, Jvion participated in a Healthcare Web Summit webinar discussion of how clinical AI differs from traditional predictive analytics and explored ways in which AI can improve patient risk trajectories while having positive impact on revenue, and identified key steps to implement adoption across organizations.  We caught up with Dr. John Showalter, Chief Product Officer, Jvion on four key takeaways from the webinar:


1. Why clinical AI? What’s the difference to other AI approaches?


Dr. John Showalter: Clinical AI focuses on an understanding of an individual patient and is designed to augment the actions and decisions of a care team. By understanding the individual drivers of risk and best actions to help a patient, an individual plan can be developed. Other AI approaches attempted to automate actions/processes, diagnose problems, or determine risk with a blackbox. The understanding of why and what to do is unique to Jvion.


2. What are the main gaps in traditional analytics like risk stratification and predictive modeling that leave healthcare organizations exposed?


Dr. John Showalter: The main gaps are predicting with non-modifiable risk factors, limited accuracy in risk predictions, population based protocols to respond to risk, and identifying too many individuals at risk. Current cohorting approaches frequently identify so many patients at risk that it is impossible to intervene on all of them effectively, especially when the individual gets an all or nothing population based protocol as an intervention.


3. What are a few of most pressing reasons for clinicians and healthcare organizations like payers to consider data augmentation in today's environment?


Dr. John Showalter: A few are: financial risk due to COVID-19, deferred care due to COVID-19, the aging population, increasing amounts of value-based contracts, increases in uncompensated care, increased consumerism, reducing health disparities.


4. What are the key things an organization should consider to ensure successful implementation and adoption of AI technology?


Dr. John Showalter: A commitment to adapting to the new insights, willingness to change workflows, identifying and tracking value attainment, identifying a need they are committed to fixing, full/broad stakeholder engagement.


If you missed this informative webinar presentation, Addressing the Iron Triangle of Healthcare With Clinical AI: Protecting Revenue While Improving Health Outcomes, we invite you to watch the On-Demand webinar video, short webinar re-cap video, or read the full Executive Brief.

Thursday
Sep032020

Viscous Cycle: Pandemic Elevating Nation’s Blood Pressure, Which Increases COVID-19 Vulnerability

By Clive Riddle, September 3, 2020

The pandemic has increased our population’s stress levels, which has increased blood pressure levels, which creates a population more vulnerable to potential damaging effects of COVID-19. Livongo has released a paper: Tracking COVID-19’s Effect on the Nation’s High Blood Pressure, that examines their own national dataset in this regard.

Livongo refers to a August 14th CDC Morbidity and Mortality Weekly Report article: Mental Health, Substance Use, and Suicidal Ideation During the COVID-19 Pandemic, which cites that “symptoms of anxiety disorder and depressive disorder increased considerably in the United States during April–June of 2020, compared with the same period in 2019”, and presents findings from their survey taken June 24–30, 2020 that include “40.9% of respondents reported at least one adverse mental or behavioral health condition, including symptoms of anxiety disorder or depressive disorder (30.9%), symptoms of a trauma- and stressor-related disorder (TSRD) related to the pandemic (26.3%), and having started or increased substance use to cope with stress or emotions related to COVID-19 (13.3%).

Livongo reminds us that “while anxiety and stress do not directly cause long-term hypertension, episodes of psycho-social stress and anxiety are well known to cause dramatic spikes in blood pressure (BP).” They note there was a 136% increase in utilization of their myStrength behavioral health solution in the period from January to May.

Livongo’s dataset in this case is driven by Livongo for Hypertension Members that “regularly measure their BP with a monitor and cuff that connect wirelessly with Livongo’s smartphone app. Readings are automatically transmitted to our Applied Health Signals platform where participants can view results.”

Their analysis did indicate a pandemic BP spike, and they report “until late January of this year the percentage of our Members nationally with high BP in any given week was on average 62%. At the end of January, however, we saw a rise in high BP roughly corresponding with the announcement of the first confirmed case of COVID-19 in the US (Jan 21) and the first mass quarantine of residents in the Chinese city of Wuhan (Jan 23). From that point forward, the proportion of our Members with high BP has mostly remained at a heightened level above 62%. An initial analysis of data at the state level shows that in 30 states the percentage of Members with high BP has increased between January and August. According to the data, high BP reached another significant peak in early to mid April when 68% of our Members nationally registered high BP.”

The implications? Livongo reminds us that “while no more susceptible to COVID-19, this population is more at risk of serious illness, hospitalization, and death from the virus. As our BP data reveals, the stress and anxiety and social isolation we have all experienced has had an outsized and measurable impact on this at-risk population.”

Livongo wasn’t the first to note this pandemic spike. Back in May, St. Luke’s Kansas City released an article in which their medical director discussed the trend: Doctors seeing more patients with high blood pressure amid coronavirus pandemic.

The American Heart Association has recently updated a guidance page: Keeping a lid on blood pressure during the coronavirus crisis, noting the need to manage stress, and cautioning that “high blood pressure might raise your risk of experiencing severe complications from the coronavirus. Nearly half of U.S. adults have high blood pressure, or hypertension, which is defined as consistent readings of 130/80 or above.”

Thursday
Aug272020

Thriving in COVID-19 Times

by Kim Bellard, August 27, 2020

These are, no question, hard times, due to the COVID-19 pandemic. Yes, these are hard times. But not for everyone.

No one should be surprised that Amazon is doing well, as more turn to online shopping and Amazon’s quick delivery, but The Wall Street Journal reports that Bog Box stores generally are doing well.

Similarly, if you’re a streaming service like Netflix or Disney+, the pandemic has been great for business. Video conferencing services like Zoom are booming. Car dealers are struggling, but not online car sales.

In healthcare, everyone seems to agree that the big winner has been telehealth. Industry leaders TelaDoc and Livongo merged, while rival Amwell got a $100 million investment from Google. No one is quite sure how much of the flexibilities introduced during the pandemic will persist once it recedes, but no one wants to miss out on what McKinsey predicts could be a $250b opportunity.

Of course, the pharmaceutical companies are doing fine in the pandemic. They’re the cockroaches of healthcare; they’re always going to survive. Some are even getting the federal government to directly pay for their vaccine research or therapeutics.

Health insurers are also proving to be big winners despite — or because of — the pandemic. Due to all those delayed/avoided treatments, they’re racking up huge profits so far in 2020.

The big loser is employer sponsored health insurance — or rather, the people who lost it. Kaiser Family Foundation estimates that 27 million people lost their health coverage due to losing their jobs in the pandemic.

Another big loser may be primary care practices, especially those not yet owned by health systems. Financial losses are predicted to be staggering, as patients stayed away in droves. As late as July, nearly 90% of primary care practices said they were still struggling due to COVID-19, according to a survey done for the Primary Care Collaborative.

Ann Greiner, president of PCC, said the report “is a clarion call to move to a new payment system that doesn’t rely on face-to-face visits and that is prospective so practices can better manage patient care.”

Hospitals also took a big hit, with the American Hospital Association predicting that losses would top $300b in 2020 due to the pandemic’s impacts. Some of these losses will be offset by the various federal bills (CARES and PPE), others by the rebound in the stock market, but some hospitals will continue to struggle — especially the already struggling rural hospitals.

During the pandemic, it has repeatedly struck me as a particular indictment of our healthcare system is that a health crisis causes so much disruption and so many financial losses. If a sick care system — which, let’s face it, is what we have — doesn’t do well when lots of people are sick, what are we doing?

In April of this year, Microsoft CEO Satya Nadella talked about the growth of its virtual platform Teams during the pandemic and declared, “In this era of remote everything, we have seen two years’ worth of digital transformation in two months.” Healthcare has also made some significant strides, but if all we take away from the pandemic is that maybe we should keep doing more telehealth, we’ll have missed the opportunity for real change.

The pandemic has important lessons for healthcare. We shouldn’t rely on employment for health insurance. We shouldn’t rely so heavily on elective procedures for health care revenues. We need to be more flexible about where and how people get their care.

This pandemic will eventually pass, in some form and with great damage. The healthcare system will survive, at least most of it. The challenge for us is to start making the changes needed for it to thrive even in the next crisis.

This post is an abridged version of the original posting in Medium. Please follow Kim on Medium and on Twitter (@kimbbellard)

Friday
Aug212020

Six Takeaways from a New White Paper for Payers on Pandemic Driven Medicaid and ACA Expansion

by Clive Riddle, August 21, 2020

Change Healthcare has just released a 13-page white paper: Pandemic-Driven Medicaid and ACA Expansion: Impacts and Considerations for Payers, that "details expected changes in the composition of national Medicaid and ACA member populations, and explores the potential financial consequences of the pandemic on payers."

Here are six takeaways from their report:

  1. Five states with the biggest percentage jump in Medicaid enrollment from Feb 2020 to May 2020: Florida - 9.8%, Missouri - 8.8%, Wisconsin - 8.5%, Minnesota - 8.4%, Kentucky - 8.1%
  2. Of those with employer-sponsored -care that are losing coverage, nearly half are eligible for Medicaid, and an additional 31% are eligible for marketplace subsidies.
  3. Expect enrollment backlogs: “Typically, a new Medicaid member is assigned to a Managed Care Organization (MCO) within 45 days after enrolling. Current processing backlogs indicate that window will likely expand significantly and it might be 60 to 90 days before members can receive care through an MCO after enrollment—and that is dependent on the availability of healthcare services.”
  4. Expect utilization backlogs: ”we expect the most dramatic impact of Medicaid member utilization to hit in 2021, when care services are likely to be more widely accessible.”
  5. Coverage will shift back: “As the economy rebounds, coverage will likely shift back to commercial lines of business and payers should be prepared for continual changes in coverage for the foreseeable future.”
  6. Five strategies are recommended payers mitigate challenges caused by the pandemic: 
  • Prepare your infrastructure by expanding provider networks to increase capacity; expect and plan for payment delays from financially unstable states.
  • Collaborate with providers to ensure that members who are most at-risk receive access to necessary healthcare services.
  • Accurately identify primary healthcare insurance coverage to reduce exposure and avoid costly recoveries.
  • Identify and capture missing risk-adjusting diagnostic codes for members by year’s end, using technology to close risk gaps and validate claims before submission.
  • Aggressively manage risk scores by identifying members in need of documentation and proactively facilitating care visits by the end of the calendar year.
Friday
Aug142020

“Buts” to Navigate in the Pandemic Acceleration of the Digital and Healthcare Experience Intersection 

By Clive Riddle, August 14, 2020

Accenture has just released a new 37-page report, the Accenture Digital Health Technology Vision 2020, based on a survey of 259 payer and provider healthcare executives, which found “that the vast majority (85%) of executives believe that technology has become an inextricable part of the human experience [and] furthermore, 45% of those polled said that rapid advancements in new technologies and scientific innovations are positioned to disrupt their industry.”

In a statement, Dr. Kaveh Safavi, a senior managing director in Accenture’s Health practice says that “COVID-19 has not slowed digital technology innovation; rather, it’s amplifying it to historic levels,” and surmised that “the intersection between digital technology and healthcare experiences has certainly accelerated with the COVID-19 pandemic, and leading the future of care will demand rethinking core assumptions about the intersection of people and technology. People’s perceptions of and relationships with technology are changing, and to adapt, healthcare payers and providers need to redesign digital experiences.”

The Accenture study found 78% of the healthcare provider and payer executives believe that the stakes for innovation have never been higher, but there are a number of “buts” in their findings that present obstacles to navigate in the middle of this digital and healthcare experience intersection, including:

  • 69% of healthcare payers and providers are already piloting or adopting artificial intelligence; BUT 39% said they have inclusive design or human-centric design principles in place to support human-machine collaboration.
  • 71% believe that robotics will enable the next generation of services in the physical world, BUT 54% believe that their employees will be challenged to figure out how to work with robots.
  • 70% of healthcare consumers polled as part of the research said they are concerned about data privacy and commercial tracking associated with their online activities, behaviors, location and interests, BUT that same number (70%) of consumers also said they expect their relationship with technology to be more prominent in their lives over the next three years.
Thursday
Aug062020

IQVIA Report on Prescription Costs: 12 Things to Know

by Clive Riddle, August 6, 2020

Pre-pandemic, much of the healthcare oxygen in any room was consumed by discussions and debate over pharmaceutical costs. While now, the focus in that arena will be on vaccine costs, certainly Rx cost concerns have been shoved by most to the back burner. And now a new report may help provide some justification in that regard.

The IQVIA Institute for Human Data Science has just released a new 41-page report:  Medicine Spending and Affordability in the U.S.: Understanding Patient Costs for Medicines, that found “the vast majority of patients in the United States are experiencing lower out-of-pocket costs for their drugs, paying a smaller share of costs and seeing a downward trend in their costs on average.” As a reminder, IQVIA was formed through the merger of IMS Health and Quintiles.

Here’s a dozen things to know from the report:

  1. Net price increases — after adjusting for rebates, discounts, other price concessions, and patient coupons to reduce out-of-pocket costs —moderated from 2.9% in 2016 to 1.7% in 2019; the third consecutive year of increases lower than growth seen in the Consumer Price Index.
  2. While 98.9% of prescriptions dispensed carry a patient payment of less than $125, the remaining 1.1% represents some 69.0 million prescription in 2019, up from 60.7 million in 2015, but with the share of prescriptions unchanged.
  3. Over the past five years, spending at list prices [Wholesaler Acquisition Cost (WAC)] has increased from $477 billion to $671 billion — an average of 7.1% per year.
  4. Manufacturer net revenues from these sales, including all products, are estimated to have grown an average of 4.6% over five years and 5.2% from 2018 to 2019.
  5. The average amount paid out of pocket per retail prescription has risen from $10.34 in 2015 to $10.67 in 2019, unchanged from 2018 and up  just $0.33 since 2014
  6. Annually, 90% of all patients pay less than $500 in out-of-pocket costs, but 20% of Medicare Part D patients pay more
  7. A record high share of prescriptions with final out-of-pocket costs below $20, exceeding 90% for the third consecutive year
  8. More prescriptions are being dispensed with $0 patient payment — 44% of all branded prescriptions in 2019, up from 36% in 2015
  9. Over 90% of branded and generic prescriptions have a final out-of-pocket cost below $20, and only 1.1% have a cost above $125.
  10. For branded prescriptions only, about 4% of have out-of-pocket costs above $125, down 1% in 2015, but still numbering more than 23 million prescriptions last year
  11. Patient out-of-pocket costs for drugs dispensed in a retail setting had been declining up to 2017, but have increased 8% and 3% in the past two years, respectively, resulting in a five-year average growth of 1.6% per year.
  12. In 2019, 9% of all new prescription starts were abandoned at retail pharmacy. While abandonment rates are less than 5% when the prescription carries no out-of-pocket cost, it rises to 45% when the cost is over $125 and 60% when the cost is over $500.
Friday
Jul312020

Data Breaches – Unfortunately Healthcare Is the Leading Industry

By Clive Riddle, July 31, 2020

IBM Security has just released their 82-page 2020 Cost of a Data Breach Report, “a global study examining the financial impact of data breaches” finding that overall “these incidents cost companies studied $3.86 million per breach on average, and that compromised employee accounts were the most expensive root cause.”

Healthcare is unfortunately the leading industry in this arena. IBM tells us that “In the healthcare industry, the average cost of a data breach in 2020 was $7.13 million. Of the 17 industries surveyed, healthcare ranked first in average cost. The average time to identify and contain a breach in this industry was 329 days.”

The study was “based on in-depth interviews with more than 3,200 security professional in organizations that suffered a data breach over the past year….Based on in-depth analysis of data breaches experienced by over 500 organizations worldwide, 80% of these incidents resulted in the exposure of customers' personally identifiable information (PII). Out of all types of data exposed in these breaches, customer PII was also the costliest to businesses studied.”

The report states that “the average cost of a data breach has fluctuated between $3.50 million and $4.00 million in recent years.” For healthcare, it averaged $8.6 million in 2015 and reached $10.0 million in 2019, before reducing to $7.1 million this year.

Their overall conclusions include:

  • ·         Companies studied who had fully deployed security automation technologies (which leverage AI, analytics and automated orchestration to identify and respond to security events) experienced less than half the data breach costs compared to those who didn't have these tools deployed – $2.45 million vs. $6.03 million on average.
  • ·         In incidents where attackers accessed corporate networks through the use of stolen or compromised credentials, studied businesses saw nearly $1 million higher data breach costs compared to the global average – reaching $4.77 million per data breach. Exploiting third-party vulnerabilities was the second costliest root cause of malicious breaches ($4.5 million) for this group.  
  • ·         Breaches wherein over 50 million records were compromised saw costs jump to $392 million from $388 million the previous year. Breaches where 40 to 50 million records were exposed cost studied companies $364 million on average, a cost increase of $19 million compared to the 2019 report.
  • ·         The Most Damaging Breaches: Data breaches believed to originate from nation state attacks were the costliest, compared to other threat actors examined in the report. State-sponsored attacks averaged $4.43 million in data breach costs, surpassing both financially motivated cybercriminals and hacktivists.

The interactive version of the report provides an industry-specific calculator that shows the average cost of a data breach associated with various factors and the average amount organizations estimated these factors either increased or decreased the cost in the selected country or industry. This analysis looks at only one variable at a time and multiple cost factors cannot be combined.

We selected the healthcare industry, and ran the calculator for the following factors, yielding industry-specific results in order of dollar magnitude:

  1. Incident Response Testing - $275,136
  2. Business Continuity Plan- $273,585
  3. AI Platform - $232,452
  4. Employee Training - $245,920
  5. Extensive Encryptions - $195,376
  6. Formation of IR Team - $193,720
  7. Security Analytics -  $186,820
  8. Board Involvement - $181,526
  9. Red Team Testing - $176,730
  10. Cyber Insurance - $175,091
  11. Vulnerability Testing - $174,708
  12. DevSecOps - $174,671
  13. Threat Intel Sharing - $160,294
  14. Data Loss Prevention - $133,583
  15. CISO Appointed - $111,532
  16. ID Theft Protection - $48,693
  17. Managed Security System- $41,946

We should note that this Wednesday, August 5, 2020, at 2 PM Eastern, Alaap B. Shah, Member of the Firm, Epstein Becker Green will update health plans on cybersecurity trends and risk management response preparedness and best practices, in the complimentary HealthcareWebSummit event: Health Plan Cybersecurity Trends and Risk Management Response Preparations.

Wednesday
Jul222020

Healthcare Needs Some #GoodTrouble

By Kim Bellard July 22, 2020

As hopefully most of you know, Rep. John Lewis, civil right icon and longtime member of Congress, died this past Friday. Rep. Lewis was often described the “conscience of Congress” — perhaps a low bar in today’s Congress but important nonetheless — for his unwavering commitment to social justice.

Rep. Lewis must have been heartened by the fact that, in 2020, plenty of people are, indeed, making noise and getting into good trouble, necessary trouble over issues that he cared deeply about, like Black Lives Matter and voting rights. There are others who are better able to write about those people and that trouble. So I’d like to talk about his call to action with respect to healthcare.

If you are working today in healthcare — especially in the United States — or, for that matter, someone getting healthcare or having a loved one get it, then you should be making some noise and getting into good trouble, because our healthcare system most definitely makes it necessary.

Every day, too many of us suffer in the healthcare system, ranging from waits to indignities to critical mistakes, and some face financial ruin due to the care — whether good or bad. Most of us suffer in silence, or only complain to our friends and family. We don’t see a lot of mass protests about the pitiful state of our healthcare system, and I have to wonder why.

We have to stop being so passive.

For those of you working in healthcare, here are the first two things I’d urge you to get into good trouble about:

The first admonition comes from a movement developed by Melinda Ashton, MD at Hawaii Pacific Health. She started asking front-line workers to identify things that were “poorly designed, unnecessary, or just plain stupid,” and — not surprisingly — there turned out to be a lot.

The second comes from advice that Dan Gingiss gives about improving customer experience. Our healthcare system is the world’s largest Rube Goldberg machine, complicated beyond understanding and with much of that complexity not achieving intended goals.

Yet we continue to add complexity, layering new technologies onto old, inserting new layers and new types of intermediaries, all of which adds costs. Even things that aren’t inherently stupid are usually more complicated than is absolutely essential.

Before we make things even more complicated, we should focusing on making the simple things better. Who is getting into good trouble about that?

If the leadership at your healthcare organization doesn’t resemble the workers in it, or, equally important, the people receiving care from it, then you should be making noise. That’s worth getting into good trouble about. That’s necessary trouble.

Or take prices. As expensive as our healthcare system is, we’ve known for a long time that our problem isn’t getting too many healthcare service as it is the prices we pay for them. If you’re working in a healthcare organization that charges the people without health insurance much more, you should be making noise. If your organization is also suing those patients to collect the resulting debts, you should be getting into good trouble to try to stop it.

And, of course, if you are working in a healthcare organization where you see patients getting services they don’t actually need, or, worse yet, delivering substandard care, then you really should be making noise and getting into good trouble. That is definitely necessary trouble.

But it’s not only those working in healthcare. If you or your loved one is receiving care, you should be making noise when you aren’t treated with respect, or when you don’t get the information you need.

We can’t be afraid to make some noise about healthcare. We must be willing to make good trouble about the many, deep, and pervasive problems in our healthcare system. If that isn’t necessary trouble, I don’t know what is.

This post is an abridged version of the original posting in Medium. Please follow Kim on Medium and on Twitter (@kimbbellard)

Friday
Jul172020

The Relationship (or lack thereof) Between a State’s Overall Health Ranking and Their COVID-19 Fatality Rate

by Clive Riddle, July 17, 2020

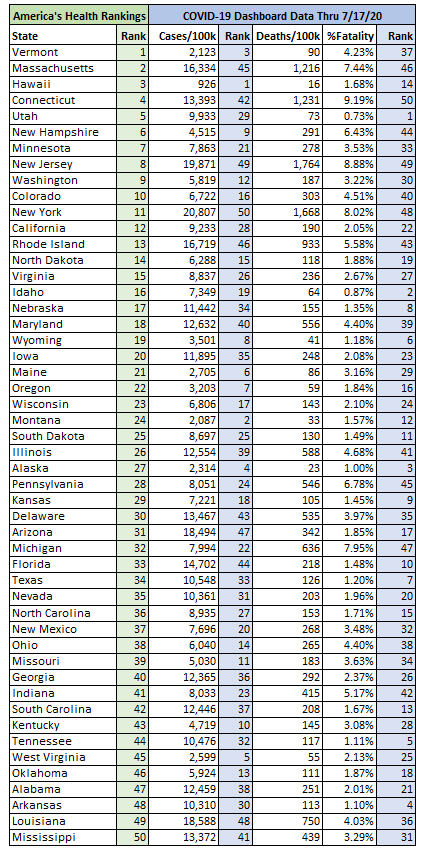
Given that co-morbidities have such an impact on COVID-19 fatalities, we thought it would be interesting to compare overall state health rankings that take co-morbidities into consideration, with COVID-19 fatality rates by state

We took the most recent results from America’s Health Rankings, their 30th annual report released in December, which provides a “comprehensive assessment of the nation’s health and on a state-by-state basis. The report includes 35 core measures of health that are used to rank states.” Would states with healthier lifestyles and lower incidence of co-morbidities translate into lower COVID-19 fatality rates? For that matter, would healthier lifestyles translate to lower case rates under the assumption those practicing healthier lifestyles might also practice more social distancing, mask-wearing and hand-washing?

We exported Johns Hopkins COVID-19 data through July 17th from the Kaiser Family Foundation State Health Facts webpage on Confirmed COVID-19 Cases and Deaths, and indicated rankings for COVID-19 fatality rates (Deaths per 1,000 / Cases per 1,000.) We also indicated the rank for Cases per 1,000 population.

The exercise unfortunately doesn’t indicate a widespread relationship. There are certain states whose rankings are similar (Utah and Hawaii in the Top 10 healthy states,) Actually, there appears to be a closer relationship in healthy state rankings and Cases/1,000 than with Fatality rates, although it is still not much of a relationship.

There are obviously more relevant factors at work here, than the overall state of a state populations’ health. But here is the state-by-state comparison of rankings:


Friday
Jul102020

The Relationship (or lack thereof) Between COVID-19 State Restrictions and Prevalence

By Clive Riddle, July 10, 2020

Wallet Hub earlier this week released updated rankings of States by Coronavirus Restrictions. The rankings were based on data available on July 6th, and assigned scores based on 18 metrics including “whether the state has any penalties for non-compliance with COVID-19 legislation to whether the state has required face masks in public and health checks at restaurants.”

They found the five least restrictive states – in order – to be South Dakota, Wisconsin, Utah, Wyoming and Oklahoma. They found the five most restrictive states – in order – to be California, Colorado, Hawaii, New Jersey, and New Mexico.

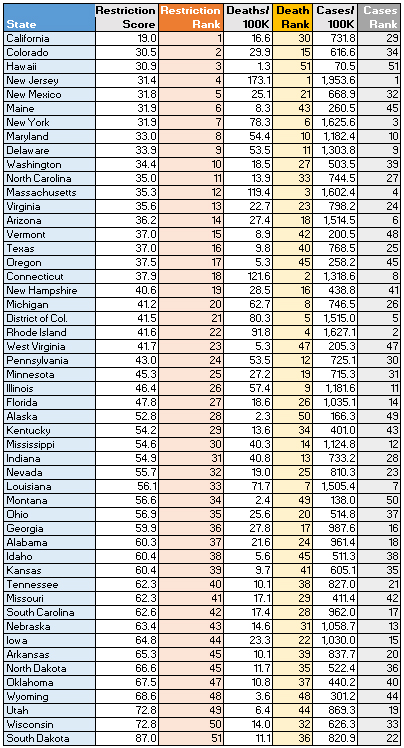
We thought it would be interesting to compare their rankings to COVD-19 prevalence, using current CDC deaths and cases per 100,000 population rates by state. The question to examine, if is there is a relative relationship between the levels of restrictions and COVID-19 deaths and cases per capita. The spreadsheet we compiled is provided below.

We reversed the rankings provided by WalletHub. They ranked states by the least restrictive – South Dakota was #1, California was #51. But in comparing Death and Case Rates where #1 would be the highest rates, we decided to rank states by the most restrictive – with the hypothesis that the most restrictive states should have the greatest prevalence.

The results were very mixed – you can select certain states to make whichever case you want. To go with the above hypothesis – you can point to Atlantic states like New Jersey, New York, Delaware and Maryland – all with a close relationship between their high levels of restrictions and high COVID-19 prevalence. You can also point to Wyoming on the other end of the scale that lines up #48 in restrictions, #48 in death rates and #44 in case rates.

On the other hand, there is Hawaii ranking third in most restrictions, but lowest in the nation in death and case rates, bolstering those who want to argue that imposing restrictions up front can result in lower prevalence (or an argument to move your state to an island.) MaIne also can make such a case – ranking 6th in restrictions but 43rd in deaths and 45th in cases (or perhaps a case to move your state further north than Toronto.) But on still another hand, California is less compelling, ranking first in restrictions but 30th in deaths and 29th in cases (California had a compelling case that deteriorated during the past month.)

And California’s deterioration of course highlights the problem that this exercise doesn’t address – the greater importance of recent change rates vs cumulative rates, and the impact of changes in restrictions. But for now, examining relationships between state approaches, and state incidence of COVID-19, is like everything else to do with the virus – quite a mess.

Thursday
Jun252020

TikTok Teens' Time

By Kim Bellard, June 25, 2020

I knew about TikTok, but not "TikTok Teens."  I was vaguely aware of K-Pop, but I didn't know its fans had common interests beyond, you know, K-Pop.  I'd been tracking Gen X and Millennials but hadn't really focused on Gen Z.  It turns out that these overlapping groups are quite socially aware and are starting to make their influence felt. 

I can't wait for them to pay more attention to health care. This generation has a lot to protest about, and a lot of ways to do it. They were in the news this past weekend due to, of all things, President Trump's Tulsa rally.  His campaign had boasted about having a million people sign up for the rally, only to find that the arena was less than a third filled.  An outdoor rally for the expected overflow crowd was cancelled. 

It didn't take long for the TikTok Teens/K-Pop fans to boast on social media about their covert -- to us older folks -- campaign to register for the rally as a way to gum up the campaign efforts.  Most doubt that these efforts had much to do with the low attendance -- it can be more likely attributed to concerns over COVID-19 and/or the concurrent Juneteenth celebrations/Black Lives Matter protests -- but they were responsible for cluttering up the Trump campaign's efforts to collect supporter/donor information from the registration.  As a subversive guerilla marketing campaign, it was brilliant -- and effective. 

It was not their first such involvement.  One of the surprises with the BLM protests have been the number young people in attendance, of all races.   Pew Research Center recently profiled Gen Z, finding them more ethnically and racially diverse, more education, more tech savvy, and, politically, "progressive and pro-government." 

Political strategist Tim Fullerton told The Washington Post: The bigger story, long-term, is that it’s really impressive to see young people using TikTok as an organizing tool. And I do think that we're going to see a lot of that in the lead-up to November. That's a difficult audience to reach, so it could be a powerful tool.  They’re using their voice in a new and different way and engaging people.  They clearly did something that hadn’t been done before.

All that is great, but it doesn't mean Gen Z is also leading the charge on healthcare, even during the pandemic.  They're no more likely to wear masks than other age groups, and are less likely to get vaccinated for it once one is available.   In many states experiencing a resurgence of COVID-19 cases, young people are increasingly being the ones infected

Dr. Thomas Tsai, a professor at Harvard's School of Public Health, warns: We need to change our whole thinking about COVID-19 during this stage of the pandemic.  It's difficult to contain the virus physically because you have younger individuals, who may be pre-symptomatic or mildly symptomatic, who are going about their normal lives and reengaging with society."

Epidemiologist Dr. Judith Malmgren told NPR that reaching Gen Z is different: "They are not reading print media. You need to be on social media. You need to use short sentences. You need to use very direct messaging."  Another epidemiologist, Dr. Wafaa El-Sadr, added: "I think young people can potentially have a very, very valuable role if we can harness their energy and attention."

If.

This is the generation that is going to inherit our apathy towards climate change and huge budget deficits.  It shouldn't have to inherit our dysfunctional healthcare system as well.  If they are looking for big, important social challenges, well, Defund Health Care!

This post is an abridged version of the original posting in Medium. Please follow Kim on Medium and on Twitter (@kimbbellard) 

Friday
Jun192020

Five Things to Know from Humana’s 2020 Bold Goal Progress Report

By Clive Riddle, June 19, 2020

Humana in 2015 launched its Bold Goal program, their population health strategy targeting specific communities, and incorporating SDoH components with the goal of improving health of these communities in applicable measures by 20%. They have just released their 2020 Bold Goal Progress Report which details the company’s progress in meeting their goal, and their “ongoing efforts to help address the impact that social determinants of health and health-related social needs, such as food insecurity and loneliness, have on the physical and mental health of the Medicare Advantage population.”

For targeted communities and populations, their program “uses the U.S. Centers for Disease Control and Prevention (CDC) Healthy Days assessment tool to measure the mentally and physically unhealthy days of individuals over a 30-day period, covering Humana member populations through lines of business such as Medicare Advantage, Group and Medicaid.”

Here’s five things to know from the 2020 Progress Report: 

  1. In their original (2015) seven Bold Goal communities, the number of unhealthy days reduced from 13.58 in 2015 to 13.27 in 2020, which non-bold goal communities increased from 13.42 to 13.45 during that time.
  2. Of the seven communities, five reduced unhealthy days from 2015-2019, while two increased: San Antonio -8.6%; Baton Rouge -4.5%; Tampa -3.7%; New Orleans -2.2%; Knoxville -2.2%; Broward +0.6% and Louisville +7.4%
  3. For the first time since Humana began benchmarking, Humana Medicare Advantage members across all markets improved their Healthy Days. 
  4. Humana screened more than 2.6 million Humana members for social determinants of health in 2019. Humana found that each member screened had an average of 3.5 health-related social needs (e.g. food insecurity, socially isolated or lonely)
  5. Depression had the most unhealthy days of six targeted chronic conditions, members with chronic obstructive pulmonary disease (COPD) had 17.94 unhealthy days (decreased 1.2% in 2019); coronary artery disease had 14.94 unhealthy days (decreased 1.8%); depression had 22.21 unhealthy days (decreased 2.9%), congestive heart failure had 17.29 unhealthy days (decreased 3.1%) and hypertension had 13.67 unhealthy days (decreased 3.2%)


Friday
Jun122020

COVID-19 and the Uncertainties for 2021 Health Plan Premiums

By Clive Riddle, June 12, 2020

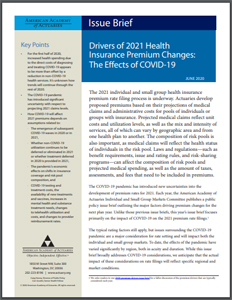
What will COVID-19 do to next year’s health plan premiums? The American Academy of Actuaries have just released a new issue brief, Drivers of 2021 Heatlh Insurance Premium Changes: The Effects of COVID-19. They tell us one thing for certain, is COVID-19 brings a whole lot of uncertainty to the equation.

Academy Senior Health Fellow Cori Uccello explains that “premium changes are based on how costs of care, enrollment, and other factors are expected to change relative to insurers' assumptions that were used in setting premiums for the current year, and the COVID-19 pandemic has brought new unknowns and opposing trends into the mix. The pandemic has introduced both positive and negative cost pressures within the health care system, and uncertainties to key projections such as claims that could be sensitive to possible subsequent waves of infection and illness.”

Four key points of their nine-page issue brief include:

1. For the first half of this year, increased health spending due to the direct costs of diagnosing and treating COVID-19 has been more than offset by a reduction in non-COVID-19 health services

2. We don’t know how trends will continue through the remainder of this year.

3. COVID-19 has introduced significant uncertainty regarding projecting 2021 claims levels

4. How COVID-19 will impact 2021 premiums depends on assumptions involving:

  • The emergence of subsequent COVID-19 waves in 2020 or in 2021
  • Whether non-COVID-19 utilization continues to be deferred or eliminated in 2021 or whether treatment deferred in 2020 is provided in 2021
  • The pandemic’s economic effects on shifts in insurance coverage and risk pool composition, and
  • COVID-19 testing and treatment costs, the availability of new treatments and vaccines, increases in mental health and substance treatment needs, changes to telehealth utilization and costs, and changes to provider reimbursement rates

With such an uncertain immediate future, perhaps the best place to start in considering premium rate impact, is to ask the right questions. Last month, MIlliman released a seven-page white paper on this topic: COVID-19: Considerations for commercial health insurance rates in 2021 and beyond.

Milliman tackled the topic by addressing these issues, and their related questions going forward:

1. Acute treatment and vaccination for COVID-19: How will COVID-19 infections and prevention impact 2021 costs? How will the cost of treatment evolve? When will a vaccine be ready, and what will it cost?

2. Access and demand for healthcare: How will the pandemic and aftermath affect access and types of care received? How long will utilization declines last, and what will patterns look like in the aftermath?

3. Lasting impacts on population health: How will the pandemic affect overall population health? How will carriers adjust rating philosophies to manager COVID-19 risk?

4. Economic impacts on enrollment and utilization: How will collateral economic damage affect enrollment and utilization patterns?

5. Disruptions to provider networks: How will provider systems be disrupted? How might this affect future contract negotiations and reimbursement structures? How will costs swings interact with one-sided and two-sided risk-sharing arrangements?

6. Operational impacts: How will disruptions and cash flow volatility impact reserve estimates used for pricing? How will delivery systems need to adapt, and how will that influence risks and costs? How might general and administrative expenses be impacted?

Friday
Jun052020

Long Term Care COVID-19 Deaths – Six Things To Know from CMS Data

By Clive Riddle, June 5, 2020

Diving into the new CMS COVID-19 Dataset on Medicare and Medicaid Long Term Care Facilities, here are six things to know from the data reported through May 31st, 2020:

1. 0.4% of the reporting facilities - the top 50 facilities by cumulative COVID-19 deaths – represent  22.6% of the COVID-19 deaths reported.

2. The top 1% of the reporting facilities– represent 35.5% of the COVID-19 deaths reported.

3. Cumulative COVID-19 Deaths reported in the dataset represent 40.4% of total deaths at those facilities. However, there may be issues with the total deaths reported in the dataset, as the COVID-19 deaths exceeded the total deaths reported in 12 of the top 50 facilities by COVID-19 alone.

4. Here is a listing of the top 20 facilities by cumulative COVID-19 deaths:

  • ·         Dellridge Health & Rehabilitation Center, Paramus, NJ (753)
  • ·         Family Of Caring Healthcare At Ridgewood, Ridgewood, NJ (517)
  • ·         Advanced Subacute Rehabilitation Center At Sewell, Sewell, NJ (396)
  • ·         Southern Pointe Living Center, Colbert, OK (339)
  • ·         Complete Care At Summit Ridge, West Orange, NJ (311)
  • ·         Blaire House Of Tewksbury, Tewksbury, MA (282)
  • ·         Pleasant View Nsg Home, Mount Airy, MD (253)
  • ·         Durand Senior Care And Rehab Center, L L C, Durand, MI (243)
  • ·         Martha T Berry Mcf, Mount Clemens, MI (214)
  • ·         Advantage Living Center - Samaritan, Detroit, MI (163)
  • ·         Avanti Wellness & Rehab, Niles, IL (158)
  • ·         Parkhouse Rehabilitation And Nursing Center, Royersford, PA (149)
  • ·         Orchard View Manor, East Providence, RI (133)
  • ·         Sunset Home, Quincy, IL (123)
  • ·         Bickford Health Care Center, Windsor Locks, CT (123)
  • ·         Neshaminy Manor Home, Warrington, PA (119)
  • ·         Park Ridge Nursing Home, Rochester, NY (119)
  • ·         Crystal Rehabilitation And Healthcare Center, Greenwood, MS (118)
  • ·         Saint Mary'S Villa Nursing Hom, Moscow, PA (114)
  • ·         Knolls West Post Acute Llc, Victorville, CA (106)
  • ·         Sunset Lake Health And Rehabilitation Center, Venice, FL (103)

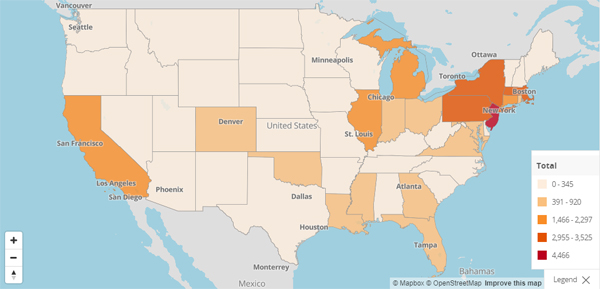
5. CMS provides this map of COVID-19 Deaths by State:

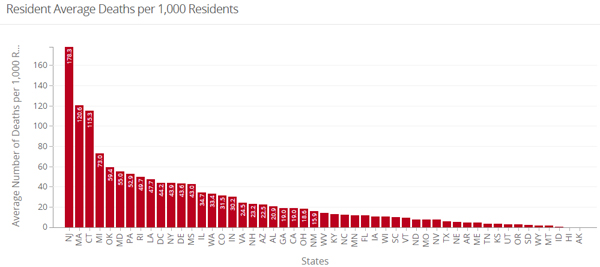
6. CMS also provides this chart of Deaths per 1,000 Residents by State, with New Jersey at 178.3, followed by Massachusetts at 120.6 and Connecticut at 115.3. The national average is 30.2:

Page 1 ... 3 4 5 6 7 ... 49 Next 20 Entries »