Search

Entries in Provider Payments (55)

Wednesday
Nov102021

A Trio of Value Based Care Surveys Indicate Technology Opportunities to Address Administrative Challenges

By Clive Riddle, November 10, 2021

The Guidehouse Center for Health Insights has just released analysis of an executive survey in conjunction with HFMA, the 2021 Risk-Based Healthcare Market Trends, that found health systems appear to be going big into risk sharing in 2022, with these percentages of respondents planning to advance into upside/downside risk sharing, professional capitation or global capitation for:

  • Medicare Advantage: 59%
  • Commercial Contracts: 52%
  • CMS APMs: 49%
  • Managed Medicaid: 36%
  • Direct Employer Contracting 33%

Guidehouse's Richard Bajner tells us "We’re seeing increased interest from providers to own the premium dollar through risk-based arrangements. On the other hand, large payers have been more aggressive in building and even investing directly in primary care assets to gain control over the flow of care and better manage services delivered to members, compounding the need for payers and providers to align closely on market strategies. These moves have led health systems to gravitate toward programs more favorable for risk-based collaborations—or payvider models — such as Medicare Advantage, managed Medicaid, and self-insured models."

Guidehouse also share that “provider respondents to the survey cited data integrity, reporting, and the cost of technology (36%) as the No. 1 internal challenge in pursuing increased levels of risk. While half of respondents are building these capabilities in-house, 30% are partnering with payers to support risk-based capabilities and 21% are outsourcing services to a third-party organization.”

Avalere has just released their fifth annual outcomes based contract findings from a 50 question survey of  51 health plans and PBMs, indicating 56% have executed an outcomes based contract for prescription drugs. They also found 12% of payers reported having more than 10 OBCs currently in place, with another 6% of payers have 5–10 OBCs. This total 18% with 5+ OBCs decreased from 25% in 2020, although the portion with 10+ contracts increased from 2020.

Avalere’s Sarah Butler tells us “the significant increase in payers who have more than 10 OBCs in place is showing us that some payers are successfully executing these agreements. At the same time, however, the decline in payers that have tried 1 OBC indicates fewer new entrants in this space.”

Avalere reminds us that "OBCs typically include an agreement between health plans and drug or device manufacturers that ties product reimbursement to specific clinical, quality, or utilization outcomes. Although innovative contracting approaches, such as OBCs, aim to align cost with value, successful implementation and adjudication of an OBC or other type of value-based contract requires significant investment into infrastructure that can support outcomes tracking and coordination among entities involved. Therefore, while some payers may have successful experiences with OBCs, some payers may face significant administrative burden and have limited success in controlling costs."

Speaking of administrative burdens, the Medical Group Management Association (MGMA) recently released their 12-page Annual Regulatory Burden Report, finding that 91% felt the overall regulatory burden on their medical practice over the past 12 months has increased.

The Medicare Quality Payment Program (MIPS/APMs) ranked third (behind Prior Authorizations and COVID-19 workplace mandates) out of nine regulatory issues with regard to physician burden level, with 6% responding MIPS/APM were not burdensome; 6% slightly burdensome; 16% moderately burdensome; and 71% very or extremely burdensome. 79% said the move toward value-based payment (in Medicare/Medicaid) has increased the regulatory burden on their practice, and 70% said the program has not improved the quality of care for their patients, or been successful to date.

It should be noted survey responses were "from executives representing over 400 group practices. 70% of respondents are in practices with less than 20 physicians and 10% are in practices with over 100 physicians. Over 80% of respondents are in independent practices." Regulatory burdens might be anticipated to be greater with independent practices, and those with less than 20 doctors.

92% responded that CMS’ feedback was not actionable in assisting their practice in improving clinical outcomes or reducing healthcare cost related to the MIPS cost performance category, and 88% said the same for the MIPS quality performance category. 93% said positive payment adjustments do not cover the costs of time and resources spent preparing for and reporting under the program.

With respect to APMs, 80% said Medicare does not offer an Advanced APM that is clinically relevant to their practice, but 63% would be interested in participating in an Advanced APM if it was clinically relevant and aligned with their quality goals.

These findings would suggest an opportunity for value based care enabling applications that are designed to achieve program goals but also simplify participation and potentially reduce administrative burdens.

Friday
Oct222021

What Collaborative Health Systems, athenahealth and Milliman Found, Sifting Through CMS ACO Performance Data

By Clive Riddle, October 22, 2021

Collaborative Health Systems has announced their affiliate Accountable Care Coalition (ACC) of Southeast Texas, Inc. generated nearly $64 million in shared savings under the Next Generation Accountable Care Organization (ACO) Model for performance years 2017 through 2020, according to CMS performance year 2020 data. CHS, reports that in 2020, the ACC of Southeast Texas achieved the following outcomes:

  • Served more than 18,000 Medicare beneficiaries across southeast Texas;
  • Achieved an overall savings rate of 12.2%, the third highest of all Next Generation ACOs; and,
  • Generated $30 million in shared savings – a 70% increase from performance year 2019.
  • Achieve a 94.6% overall quality score
  • The network has experienced a 20% decrease in inpatient discharges per 1,000 and a 29% decrease in ER visits per 1,000 since 2012.

The Accountable Care Coalition of Southeast Texas has participated in the Next Generation ACO initiative since the program's first performance year in 2016. Performance year 2021 represents that last year of the Next Generation ACO Model. Collaborative Health Systems will be managing four Direct Contracting Entities with a presence across 24 states. CHS currently manages two Next Generation ACOs, one Direct Contracting entity, eight MSSP ACOs, a Care Transformation Organization, and three Independent Practice Associations. CHS is a wholly owned subsidiary of Centene Corporation.

Meanwhile, athenahealth reports their ACO clients "earned a total of $143 million in savings in the 2020 Medicare Shared Savings Program (MSSP)", and among their ACO customers, "81% generated shared savings and 100% avoided losses. In addition, athenahealth’s ACO customers achieved an average quality score of 97.8% for 2020 and earned an average shared savings of $22.59 per member per month (PMPM), which compares to an average of $16.23 for all other ACOs participating in MSSP."

Milliman researchers recently published results of their analysis of ACO characteristics determined to be strongly predictive of MSSP gross savings, comparing current ACO performance analytics to a previous study conducted in 2015.

Milliman researchers found that the drivers of recent success are quite different and, in some cases, the opposite of what they were in 2015. With Pathways to Success, CMS endeavored to reshape the MSSP by adjusting incentives, encouraging greater accountability in ACOs, and offering options specific to each ACO’s ability to take on risk. Their analysis gives early indication that these changes are rewarding ACOs for attained efficiency levels, possibly enhancing the attractiveness of the program. Furthermore, the authors also see evidence of at least some correlation between tracks with downside risk and higher gross savings, supporting CMS’s case for accountability as a policy priority, though voluntary track selection may also be playing a role. Lastly, the authors see some indication that ACOs strongly emphasizing primary care are having greater success than their peers.

The Milliman team involved in this study will be presenting their findings in a new HealthcareWebSummit webinar: Key Drivers of ACO MSSP Results - What Predictive Analytics Can Tell Us, to be held Thursday, November 18th, 2021 at 1PM Eastern.

Thursday
Dec102020

Overcoming barriers to provide patient-centered care

By Dr. Seleem R. Choudhury, December 10, 2020

The term "patient-centered care" is in vogue and utilized by health system administrators, marketing gurus, hospital staff, and clinicians alike. It's a catchy phrase that resonates with stakeholders, and it sounds like something every healthcare organization would heartily embrace. However, the heart of patient-centered care and its implications for how care is actually provided to patients is not well understood.

The Institute of Medicine defines patient-centered care as "providing care that is respectful of, and responsive to, individual patient preferences, needs, and values, and ensuring that patient values guide all clinical decisions" (HealthLeads, 2018; Wolfe, 2001). The goal of patient-centered care is focused primarily on the health outcomes of the individual rather than the entire population (NEJM Catalyst, 2017). However, by prioritizing the individual's health, populations' health outcomes are improved as well (Cramm & Neiboer, 2016).  Additionally, patient-centered care presents possible economic advantages for both hospitals and patients (David, Saynisch, & Smith-McLallen, 2018).

However, there are many barriers that must be overcome to live up to the aspirational definition of patient-centered care and experience the benefits this approach offers. 

Barriers to patient-centered care

An article released last year by Academy Health outlines many of the barriers to patient-centered care (Sinaiko, Szumigalski, Eastman, & Chien, 2019). It highlights that these barriers are "pervasive" within the healthcare system.  The current lack of agility within healthcare as an industry has limited the customizability of care delivery, and there are many broad sections of the population that are paying the price.

Reimbursements

Erasmus spoke of "the talking power of money," and it is true that "money talks" centuries later in today's healthcare system. Many healthcare systems continue to utilize fee-for-service. While this approach is hotly debated amongst healthcare professionals and economists, many believe fee-for-service models create incentives for providers to encourage face-to-face or volume building visits, and are widely indicted for promoting care that is inefficient, uncoordinated, and too often fails to meet the needs of patients (Agency for Healthcare Research and Quality, 2002). 

The fee-for-service system serves to drive up volume and encourages hospital and community health organizations to make money and support their healthcare system rather than the needs of the patient.  This may lead providers to perform unnecessary surgeries, x-rays, or lab work, to name a few common examples, in order to increase revenue, rather than focus on the patient's desire to receive only the care they need at a cost they can afford.

It is recognized, however, that the fault does not just rest with the organization. Often, the regulatory burden on providers and hospitals is unrealistic and cumbersome, stifling innovation (Secretary of Health and Human Services, 2018). This can lead to the tail wagging the dog with organizations feeling pressure to meet regulatory needs before addressing patient needs in order to gain reimbursements.

Organizational culture

Unsurprisingly, the culture of the organization impacts patient outcomes and the practice of patient-centered care (Hahtela, McCormack, Doran, Paavilainen, Slater, Helminen, & Suominen, 2017). It is not enough to simply tout a patient-centered approach in annual reports, periodic training, glossy posters, mission statements, email signatures, or quick notes in a staff meeting. Everyone associated within the organization—from executives to clinicians to non-clinical support staff to volunteers—must hold attitudes and beliefs consistent with patient-centeredness (Gorli, Liberati, Galuppo, & Scaratti, 2016; Agha, Werner, Reddem, Huseman, Long, & Shea, 2018).

The organization must become transformational to make patient-centered care a reality, not just a nice sentiment.  This will require training for all employees and a mindset shift from the top down.

Inadequate trust

Patients often do not trust their clinician's management of their health. This is due in part to a lack of transparency combined with the steadily rising cost of care over decades. Healthcare is the only industry in the world where consumers have no idea how much money they will be required to spend on a service prior to receiving it.  Clinicians are unable to tell their patients how much their care is going to cost—how could there not be a lack of trust?

We see evidence of this lack of trust consistently in issues with medication compliance among patients with chronic medical conditions.  According to a recent article in Practical Pain Management, "approximately 125,000 people with treatable diseases die each year in the U.S. because they do not take their medication as prescribed, while 10% to 25% of hospital and nursing home admissions result from uninitiated or incomplete prescribed treatment plans" (Cosio & Demyan, 2020).  Data suggests that if a stronger, more respectful, and trusting relationship exists with the patient, then the patient is likely to be more compliant with their treatment (Sladdin, Ball, Bull, & Chaboyer, 2017).

Social determinants of health

Social determinants of health include the social factors that impact a patient's ability to achieve health and wellness.  We live in an electronic age, and it seems bizarre that this crucial information is missing from patients' medical history. But the fact is that data on social determinants of health is not consistently collected, thus stunting patient-centered care efforts.

A lack of understanding or reliable methods for collecting this information translates to a lack of understanding of the needs of the patient.  When providers do not have information on what patients have and what they need—whether poverty, educational issues, or homelessness, for example—it impacts their ability to achieve positive health outcomes for their patients (Heath, 2017). 

Pandemic

A barrier not mentioned in the Academy Health article is the current global pandemic.  COVID-19 has impacted patient-centered care, especially as care delivery is focused on the most acute cases (Carlos, Lowry, & Sadigh, 2020). Staff are stretched too thin to take into account patient preferences.

Non-COVID treatment often comes with a list of precautions to prevent spreading the virus and less flexibility in care and support options.  Many hospitals have suspended visitors, so the patient is left alone without their loved ones, who often act as a support system and a channel of communication with care providers.

Strategies and solutions

Despite the many substantial barriers to implementing patient-centered care in the healthcare industry, hospitals and healthcare professionals are finding ways to overcome these obstacles and put the needs of the patient first.  A 2018 report supported by the Robert Wood Johnson Foundation, titled Moving Patient-Centered Care Forward: How Do We Get There?, identifies several actionable strategies.

Improve diversity.

Improved diversity among the healthcare workforce will result in increased opportunities for patients to receive care from someone who shares the same racial or ethnic background.  This is essential for improved individual health outcomes, as data has repeatedly shown that compliance with physician recommendations is heightened when patients identify with the ethnicity of their provider and clinical team (Khullar, 2018).

In addition, a study found that patients were more likely to give the maximum patient rating score and were more compliant with the treatment regime when they identified with their provider's ethnicity (Takeshita, Wang, & Loren, 2020). In addition to hiring a more diverse workforce, hospitals must also collect information regarding patient ethnicity, and take steps to take ethnicity into account in a patient's care.

Embrace innovation.

The healthcare industry needs to think outside the box not only when it comes to improving care, but also reimbursement for care. Patient-centered care is increasingly delivered in teams, both within healthcare systems and through referral relationships with other organizations. A lot of work goes on behind the scenes that is often not reimbursable. Developing an innovative system that rewards collaboration will help undo a payment system that does not adequately compensate for this work. 

Collaborate with community organizations.

The African proverb, "It takes a village to raise a child," rings true for organizations that have embraced patient-centered care. Too often hospitals think they are the be-all-end-all of their patients' care, but in reality, there are many people and organizations, such as schools, food banks, and local agencies, to name a few, that contribute to a person's health.  Hospitals must change their focus from protecting their volume and growing their service line to embracing their role as a contributor to the health of their community for the sake of their patients.

Serve the "whole patient."

Transforming the culture of an organization to deliver care in a way that better serves the "whole" patient is a complex endeavor. To put a patient's needs first requires that the organization be willing to put its own needs second. A commitment within the organization to permit staff to address patient needs as they arise, even if the service is not in their job description, sounds good on a mission statement or strategic plan. However, it will require hospitals to invest in training their staff and creating a culture that focuses on customer service, respect, and patient empowerment.

Promote transparency.

A lack of transparency inevitably leads to a lack to trust, and we must listen to patients' and the government's demands for increased transparency in the healthcare industry. The 21st Century Cures Act, set to take effect in April 2021, will help all patients to have immediate electronic access to their detailed notes and records. The intent is to lower costs, create improved trust with transparent conversation between provider and the patient, and empower the patient to make more informed healthcare decisions. 

Transparency doesn't end there. There needs to be greater openness and ease in hospital billing practices, billing and cost understanding, and the ins and outs of the insurance reimbursement system. Hospitals' pay codes are indecipherable to patients trying to interpret their billing statements. Patients need to see actual costs if they are to be empowered to make wise decisions for their physical and financial health. 

Rethink compliance.

Regulations meant to ensure that all patients receive quality care have unwittingly turned the healthcare industry into a tick-box culture where hospitals are incentivized to provide care to the lowest common denominator to keep agencies off their back.

There is something for healthcare leaders to ponder in Amazon CEO Jeff Bezos's statement to shareholders in 2016: 

"Good process serves you so you can serve customers. But if you're not watchful, the process can become the 'thing.' This can happen very easily in large organizations. The process becomes the proxy for the result you want. You stop looking at outcomes and just make sure you're doing the process right."

In healthcare as well as in the tech sector, the process of ensuring regulatory compliance can too easily become the "thing," much to the chagrin of clinicians. As a result, care can become encumbered, slow, and legalistic, rather than dynamic, patient-focused, and friendly (Sims, Leamy, Levenson, Brearley, Ross, & Harris, 2020).

It is clear that to deliver patient-centered care organizations must not be held hostage to meeting regulatory requirements. Instead, they should look beyond the minimum and understand their patients when designing a patient-centric model that not only surpasses the minimum requirement for compliance, but also delivers clinical excellence.

Placing the patient in their rightful place at the center of all healthcare organizations do is an ongoing journey and not an endpoint.  Embracing patient-centered care is a paradigm shift that will require healthcare partnership, adoption and acceptance by every person in the healthcare organization, and openness to innovative approaches in an ever-evolving and complex healthcare system.

Read more from Dr. Seleem Choudhury at seleemchoudhury.com 

References:

Agency for Healthcare Research and Quality (2002). Improving Health Care Quality.

Agha, A., Werner, R., Keddem, S., Huseman, T., Long, J., & Shea, J. (2018). Improving Patient-centered Care. Medical Care, 56(12).

Bezos, J. (2017). 2016 Letter to Stakeholders. Amazon News.

Brickley, B., Sladdin, I., Williams, L., Morgan, M., Ross, A., Trigger, K., & Ball, L. (2019). A new model of patient-centred care for general practitioners: results of an integrative review. Family Practice, 37(2).

Carlos, R., Lowry, K., & Sadigh, G. (2020). The Coronavirus Disease 2019 (COVID-19) Pandemic: A Patient-Centered Model of Systemic Shock and Cancer Care Adherence. Journal of the American College of Radiology, 17(7).

Cosio, D., & Demyan, A. (2020). Adherence and Relapse – How to Maintain Long-Term Gains in Patients with Chronic Conditions. Practical Pain Management, 20(6). 

Cramm, J. & Nieboer, A. (2016). Is "disease management” the answer to our problems? No! Population health management and (disease) prevention require “management of overall well-being.” BMC Health Services Research.

David, G., Saynisch, P., & Smith-McLallen, A. (2018). The economics of patient-centered care. Journal of Health Economics, 59.

Delaney, L. (2018). Patient-centred care as an approach to improving health care in Australia. Collegian, 25(1). 

Gorli, M., Liberati, E., Galuppo, L., & Scaratti, G. (2016). Promoting Patient Engagement and Participation for Effective Healthcare Reform. IGI Global.

Hahtela, N., McCormack, B., Doran, D., Paavilainen, E., Slater, P., Helminen, M., Suominen, T. (2017). Workplace culture and patient outcomes: What's the connection? Nursing Management, 48(12). 

Health Leads (2018). Patient-Centered Care: Elements, Benefits And Examples

Heath, S. (2017). Using Social Determinants of Health in Patient-Centered Care. Patient Engagement Hit.

Hughes, T., Varma, V., Pettigrew, C., & Albert, M. (2015). African Americans and Clinical Research: Evidence Concerning Barriers and Facilitators to Participation and Recruitment Recommendations. The Gerontologist, 57(2).

Khullar, D. (2018). Even as the U.S. grows more diverse, the medical profession is slow to follow. The Washington Post.

Moretta Tartaglione, A., Cavacece, Y., Cassia, F. and Russo, G. (2018). The excellence of patient-centered healthcare: Investigating the links between empowerment, co-creation and satisfaction. The TQM Journal. 30(2), pp. 153-167.

National Institutes of Health (2020). The 21st Century Cures Act.

NEJM Catalyst (2017). What Is Patient-Centered Care?

Ogden, K., Barr, J., & Greenfield, D. (2017). Determining requirements for patient-centred care: a participatory concept mapping study. BMC Health Services Research.

Robert Wood Johnson Foundation (2018). Moving Patient-Centered Care Forward: How Do We Get There?

Ruppar, T., Ho, P., Garber, L., & Weidle, P. (2017). Overcoming Barriers to Medication Adherence for Chronic Diseases. Centers for Disease Control and Prevention. 

Secretary of Health and Human Services (2018). Secretarial Response.

Sims, S., Leamy, M., Levenson, R., Brearley, S., Ross, F., & Harris, R. (2020). The delivery of compassionate nursing care in a tick-box culture: Qualitative perspectives from a realist evaluation of intentional rounding. International Journal of Nursing Studies, 107.

Sinaiko, A., Szumigalski, K., Eastman, D., Chien, A. (2019). Delivery of Patient Centered Care in the U.S. Health Care System: What is standing in its way?. Academy Health.

Sladdin, I., Ball, L., Bull, C., & Chaboyer, W. (2017). Patientcentred care to improve dietetic practice: an integrative review. Journal of Human Nutrition and Dietetics, 30(4), 453-470.

Takeshita, J., Wang, S., Loren, A., et al. (2020). Association of Racial/Ethnic and Gender Concordance Between Patients and Physicians With Patient Experience Ratings. JAMA Network Open. 

Wall Street Journal (2015). Should the U.S. Move Away From Fee-for-Service Medicine?

Wolfe, A. (2001). Institute of Medicine report: Crossing the quality chasm: a new health care system for the 21st century. Policy, Politics, & Nursing Practice, 2(3), 233-235.

Yuan, S., Freeman, R., Hill, K., Newton T., & Humphris, G. (2020). Communication, Trust and Dental Anxiety: A Person-Centred Approach for Dental Attendance Behaviours. Dentistry Journal.Communication, Trust and Dental Anxiety: A Person-Centred Approach for Dental Attendance Behaviours.
Friday
May152020

Surveying COVID-19 Financial Impact on Providers

By Clive Riddle, May 15, 2020

NEPC’s Healthcare Practice Group has just released survey results from a diverse set of healthcare organizations around the country on financial steps they are taking during the pandemic. Here's what NEPC found:

  • ·         78% have or will access lines of credit
  • ·         96% anticipate additional government assistance
  • ·         61% have already, or plan on, furloughing staff
  • ·         43% have already, or plan to, suspend or postpone retirement plan contributions (28% of with organizations $2B in assets did so,  compared to 63% with a credit rating of BBB or lower)
  • ·         56% said their daily burn rates increased by up to 25%, while 23% of respondents indicated a daily burn increase of more than 25%
  • ·         28% of East Coast organizations had 25%+ burn increases, vs 8% of West Coast organizations

In late April, Merritt Hawkins and The Physicians Foundation released national physician survey results that found

  • ·         48% are treating patients through telemedicine, up from 18% in 2018
  • ·         21% of physicians have been furloughed or experienced a pay cut
  • ·         14% plan to change practice settings as a result of COVID-19
  • ·         18% plan to retire, temporarily close their practices, or opt out of patient care

Also, the California Medical Association in late April released the results of its COVID-19 Physician Financial Health Survey, which found that "95% of physician practices are worried about their financial health due to the COVID-19 public health emergency. Practice revenue has declined by 64% since March 1, 2020, with 75% of practices experiencing a revenue decline of 50% or greater."

Friday
Jan242020

The Yellow Brick Road to Savings $13B In Further Automated Healthcare Administrative Transactions

By Clive Riddle, January 24, 2020

CAQH has released their seventh annual report  - the 2019 CAQH Index - which measures "the progress made by the healthcare industry in reducing the costs and burden associated with administrative transactions through automation. Their 49-page report found that "of the $350 billion dollars widely cited as the cost of administrative complexity in the US healthcare system, $40.6 billion is spent on eight administrative transactions. Of that, the industry can save $13.3 billion, or 33 percent of existing annual spend, by transitioning to fully electronic processes." 

Regarding the $13.3 billion in potential savings through automation, the report tells us “$9.9 billion can be saved by the medical plans and providers, while $3.4 billion can be saved by the dental industry. In both industries, the greatest savings exist for providers as compared to plans.”

The Index report “analyzes levels of automation, spending and savings opportunities for eight administrative transactions related to verifying patient insurance coverage and cost sharing, obtaining authorization for care, submitting claims and supplemental information and sending and receiving payments.”

What are these eight transaction categories, and what were their corresponding rates of full electronic transaction processing in 2019 vs. 2015?

  1. Eligibility and Benefit Verification:  84% 2019 | 71% 2015
  2. Prior Authorization  13% 2019 | 10% 2015
  3. Claim Submission  96% 2019 | 94% 2015
  4. Attachments  20% 2019 | NA 2015
  5. Coordination of Benefits  86% 2019 | 49% 2015
  6. Claim Status Inquiry  70% 2019 | 57% 2015
  7. Claim Payment  70% 2019 | 61% 2015
  8. Remittance Advice  50% 2019 | 51% 2015

Of these eight transaction categories  - the term “Attachments” might be a little generic and require further definition. CAQH defines Attachments as "the exchange of patient-specific medical information or supplemental documentation needed to support administrative transactions and clinical decisions." They go on to say "serving as a bridge between clinical and administrative data, attachments are also critical to the success of value-based payment models" and that the majority of attachments are exchanges through mail and fax as opposed to electronically.

The largest remaining estimated savings opportunities from further automation are with:

  • Eligibility and Benefit Verification:  $4.24 Billion
  • Claim Status Inquiry: $2.16 Billion
  • Remittance Advice: $1.85 Billion

CAQH’s call to action for the industry to achieve these savings centers around:

  • Focusing efforts to reduce provider burden
  • Accelerating standards and operating rule development to support harmonization of administrative and clinical data exchange
  • Needing vendor adoption of all standards and operating rules; and
  • Expanding research related to the administrative workflow
Friday
Jan172020

The CMS Innovation Center: Innovative Savings Projections?

Avalere has released a report: CMMI’s Financial Impact on Medicare Spending Challenging to Project, which concludes “CMMI’s impact on Medicare spending has not reached earlier projections by the Congressional Budget Office (CBO), demonstrating the difficulty in projecting savings from untested and future unknown alternative payment models.”

Before we delve into the details of Avalere’s findings, let’s take a step back and peek into what goes on these days at The Center for Medicare & Medicaid Innovation (CMMI), which they now like to refer to as the CMS Innovation Center.

The CMS Innovation Center tells us they develop new payment and service delivery models brought about by the Affordable Care Act and other legislation, overseeing a number of specific demonstrations to be conducted by CMS; and implement the Quality Payment Program brought about by MACRA. The demonstrations and QPP were developed with an underlying assumption of savings to be accrues, and Avalere is now finding the savings have missed their targets.

The CMMI site provides tables itemizing the Alternative Payment Models in the Quality Payment Program, which list 50 specific Alternative Payment Models (APMs), plus Other Payer Advanced APMs including 7 Medicaid Other Payer Advanced APMs; 59 Medicare Health Plan Payment Arrangements; and 2 CMS Multi-Payer Payment Arrangements.

The CMMI Site indicates 90 specific demonstration models, which fall under seven categories:

  1. Accountable Care
  2. Episode-based Payment Initiatives
  3. Primary Care Transformation
  4. Initiatives Focused on the Medicaid and CHIP Population
  5. Initiatives Focused on the Medicare-Medicaid Enrollees (dual eligible)
  6. Initiatives to Accelerate the Development and Testing of New Payment and Service Delivery Models
  7. Initiatives to Speed the Adoption of Best Practices

Given this scope, Avalere tells us that "CBO’s 2010 projection was $1.3 billion in net federal government savings from CMMI over the 2010-2019 budget window. In 2015, CBO began projecting more substantial savings from CMMI: $27 billion in net federal government savings over the 2016-2025 budget window; and then in 2016, $34 billion in net federal government savings over the 2017–2026 budget window."

Avalere however “estimates net Medicare savings of $18.0 billion from CMMI for the 2017-2026 budget window, lower than the $34 billion projected by the CBO in 2016. Net Medicare savings reflects expected reduced Medicare program expenditures net of CMMI outlays.” They break down their projection as follows:

  1. The continuation and expansion of already-existing CMMI demonstrations generate $4.4 billion in gross Medicare savings between 2017 and 2026. 
  2. Proposed demonstrations generate $21.4 billion in gross Medicare savings for 2017–2026. 
  3. CMMI will launch new, not yet proposed demonstrations that generate $3.3 billion in gross Medicare savings for 2017–2026.

Of course, the aftermath of a Presidential election year could bring about any number of scenarios that could spin CBO or Avalere projections sideways.

Friday
Jan112019

Two New Milliman White Papers On MSSP Pathways to Success: 

Final Rule Revisions and Data Mining Tactics to Reduce Population Costs

By  Clive Riddle, January 11, 2019

Milliman's Noah Champagne, Charlie Mills, and Jason Karcher published a white paper on January 7th: “Pathways to Success” MSSP final rule: Key revisions to the proposed rule, which was preceded with a paper on January 4th by Kathryn V. Fitch, Adam Laurin, and Michele M. Berrios: “Pathways to Success” MSSP final rule: Faster movement to downside risk increases focus on reducing population costs.

The final rule isn’t a radical departure from the proposed rule, but as Champagne, Mills and Karcher summarize, these are the key changes from the proposed rule:

  • Levels A and B maximum shared savings percentage increased from 25% to 40% while Levels C and D increased from 30% and 40%, respectively, to 50%.
  • Less strict definition of low-revenue ACO: Now ACOs are considered “low revenue" if their historical Medicare Part A and B fee-for-service (FFS) revenues are less than 35% of the total historical expenditures for their assigned Medicare beneficiaries. 
  • High-revenue ACOs currently participating in MSSP Track 1+ will be allowed an exception to renew for one agreement period in Level E of the BASIC track.
  • New, low-revenue ACOs, not experienced with performance-based Medicare ACO initiatives, will be allowed to remain in Level B (one-sided risk) for an additional performance year. 
  • The final rule retains the proposed 3% cap on benchmark increases for risk scores. However, ACOs’ benchmarks will be fully adjusted for changes in the relative risk score when there is a decrease from the baseline year to the performance year instead of applying a 3% reduction cap as originally proposed.
  • The final rule still uses a maximum regional cost blending percentage of 50%, but finalizes a more gradual phase-in of the maximum blending percentage from the proposed rule for ACOs with historical expenditures above their regional service areas.
  • ACOs participating in the July to December 2019 performance period and selecting prospective assignment will be assigned beneficiaries based on October 2017 to September 2018 experience data.

Champagne, Mills and Karcher conclude that “CMS introduced the MSSP with the goal of transitioning ACOs to becoming risk-bearing entities and improving the quality of care provided to Medicare FFS beneficiaries. With the MSSP final rule, CMS has reaffirmed its commitment to these goals while offering greater shared savings potential to ACOs participating in the BASIC track and making the BASIC track available to a broader set of ACOs. The effect of these rule changes on specific ACOs will vary significantly depending on an ACO’s size, region, cost and quality performance, and structure.”


Fitch, Laurin and Berrios remind us that “one of the hallmarks of the new MSSP rule is faster movement to downside risk. Under the current regulations, accountable care organizations (ACOs) can stay in an upside-only track for up to six years. The new rule requires some ACOs in the Basic Track to begin assuming some downside risk in year 3.”  They stat that “under the new rule, there will be a more urgent need for ACOs to reduce population costs,” and that “two major tactics are typically implemented by health plans and ACOs to reduce population costs” are demand management and supply management.


Their report “focuses on supply management and, in particular, data mining tactics that identify medically unnecessary services.” They advocate "several data mining tactics we have seen successful ACOs adopt to effectively guide strategies to reduce medically unnecessary services and in turn reduce the ACO’s total population costs." including:

  • "For MSSP participants, the monthly Claim and Claim Line Feed (CCLF) data files provided by CMS should be routinely grouped and summarized into an actuarial cost model in order to evaluate cost drivers, identify potential targets for utilization reduction initiatives, track outcomes expected from key initiatives, and track overall costs compared to the ACO’s PMPY expenditure benchmark set by CMS."
  • "After identifying potential services to target from the actuarial cost model, organizations need to evaluate whether the utilization and spend in a service category represents efficient or inefficient care with very little or very large opportunity for improvement."
  • "ACOs must be able to target inefficient physician performance, which requires credible provider profiling. As with the benchmarking exercise described previously, physician profiling requires credible risk adjustment."
  • "ACO should also consider data mining to identify leakage of services to providers outside of the ACO." 
Friday
Nov302018

EHR and Patient Self-Pay: A Tale of Two Provider Woes

By Clive Riddle, November 30, 2018

In the provider administrative world, two continuing challenges causing large audible sighs are dealing with EHRs and ever-increasing levels of patient cost-sharing. An 11-page report just released on the annual HFMA/Navigant survey tackles these topics, providing findings from responses of 107 hospital and health system CFOs and revenue cycle management executives.

On the EHR front, we are told that 56% of executives “said their organizations can’t keep up with EHR upgrades or underuse available EHR functions, up from 51% last year. Moreover, 56% of executives suggested EHR adoption challenges have been equal to or outweighed benefits specific to their organization’s revenue cycle performance.”

Timothy Kinney, managing director at Navigant, says “hospitals and health systems have invested a significant amount of time and money into their EHRs, but the technology’s complexity is preventing them from realizing an immediate return on their investments.”

The survey found that 44% quickly adapt to EHR functional release, and the above cited 56% includes 39% that underutilize available EHR functions, and 17% can’t keep up with EHR functions. Regarding adoption challenges and benefits, the also above cited 56% includes 34% stating benefits and challenges are equal, and 22% who feel challenges outweigh benefits.

Regarding patient self-pay, the report tells us that 81% of executives “believe the increase in consumer responsibility for costs will continue to affect their organizations, down from 92% last year. Among them, 22% think that impact will be significant, compared to 40% last year. Executives from health systems and larger hospitals believe their organizations will be more heavily impacted by consumer self-pay.”

Navigant Managing Director James McHugh comments that “the impact of consumer self-pay on providers will only increase with the popularity of high-deductible health plans and negative changes to the economy. Providers must take advantage of opportunities to more holistically educate patients on out-of-pocket costs, predict their propensity to pay as early as possible, and secure alternative payers or financing when needed.”

The survey results seem to indicate self-pay continues to be a big issue, yet is more manageable now than a year ago. Time will tell if that trend continues.


Friday
Oct122018

The State of BPCI

by Clive Riddle, October 12, 2018

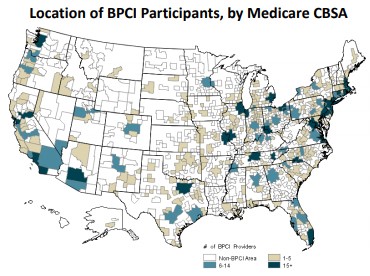
CMS announced that “1,299 entities have signed agreements with the agency to participate in the Administration’s Bundled Payments for Care Improvement – Advanced (BPCI Advanced) Model.  The participating entities will receive bundled payments for certain episodes of care as an alternative to fee-for-service payments that reward only the volume of care delivered. The Model participants include 832 Acute Care Hospitals and 715 Physician Group Practices – a total of 1,547 Medicare providers and suppliers, located in 49 states plus Washington, D.C. and Puerto Rico.”

CMS also reminds us that “BPCI Advanced qualifies as an Advanced Alternative Payment Model (Advanced APM) under MACRA, so participating providers can be exempted from the reporting requirements associated with the Merit-Based Incentive Payment System (MIPS).”

CMS further explains these three differences between the new BPCI Advanced Model and the original BPCI Initiative that ended September 30, 2018:

  1. BPCI Advanced offers bundled payments for additional clinical episodes beyond those that were included in BPCI, including – for the first time – outpatient episodes.
  2. BPCI Advanced provides participants with preliminary target prices before the start of each model year to allow for more effective planning. The target prices are the amount CMS will pay for episodes of care under the model.
  3. BPCI Advanced qualifies as an Advanced APM.  Participating clinicians assume risk for patients’ healthcare costs and also meet other requirements including meeting quality thresholds, potentially qualifying them for incentive payments and exempting them from the MIPS program.

CMS has released results of its evaluation of the original BPCI Initiative, Models 2-4 for Years 1 -3 (through 12/31/2016.) CMS notes that “Model 2 episodes begin with a hospital admission and extend for up to 90 days; Model 3 episodes begin with the initiation of post acute care following a hospital admission and extend for up to 90 days; and Model 4 episodes begin with a hospital admission and continue for 30 days. The BPCI initiative rewards participants in Models 2 and 3 financially through reconciliation payments for reducing Medicare payments for an episode of care relative to a target price. Alternatively, when episode payments are higher than the target price, Awardees may have to pay amounts to CMS. Under Model 4, Medicare makes a prospective payment for the episode, so Awardees keep the difference if their costs are below the prospective payment.”

Of all participants, 22% of Model 2, 33% of Model 3, and 78% of Model 4 participants withdrew from the initiative.

CMS evaluation is based on the 169-page study just released by the Lewin Group: CMS Bundled Payments for Care Improvement Initiative Models 2­4: Year 5 Evaluation &  Monitoring Annual Report. Their findings included:

  • While BPCI was associated with a decline in episode payments, after considering the reconciliation payments made to participants, BPCI did not result in savings to the Medicare program.
  • Across the 67 Model- participant- and clinical episode-combinations analyzed in this report, payments declined for 50 and the change was statistically significant for 27.
  • The average Model 2 episode initiator (EI) participated in eight clinical episodes, and the most commonly selected clinical episode was MJRLE. BPCI Model 2 accounted for nearly 90% of the approximately 796,000 episodes initiated during the first 13 quarters of the initiative.
  • Episode volume was lower than in Model 2. Skilled nursing facility (SNF) EIs were most likely to participate in MJRLE, where they initiated over 9,600 episodes during the first 13 quarters of the initiative. Congestive heart failure (CHF) had the greatest enrollment of home health agency (HHA) EIs and the largest patient volume, exceeding 4,800 episodes during the same period.
  • Participation in Model 4 continued to wane in the third year of the initiative. Only five hospitals participated in Model 4 in 2017 and another three Model 4 hospitals transitioned to Model 2 rather than withdraw entirely from the initiative. At the peak of enrollment, 23 episode-initiating hospitals participated in Model 4. A total of 13,551 episodes, primarily for MJRLE, were initiated under the Model through December 2016.


Friday
Sep142018

Post ACA Operating Margins: Health Systems and Health Plans

By Clive Riddle, September 14, 2018

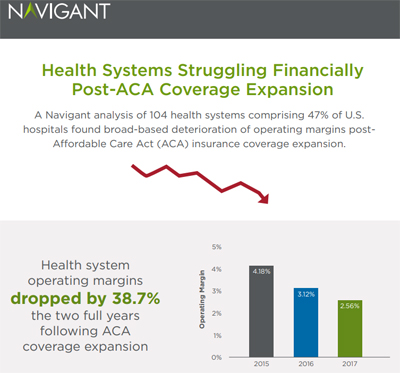
Navigant this week released an eight-page report: Stiffening Headwinds Challenge Health Systems to Grow Smarter, that provides “an analysis of a three-year sample of the financial disclosures of 104 prominent health systems operating 47% of U.S. hospitals,” in which Navigant  “found broad-based and significant deterioration of operating earnings.”


Navigant reports that from 2015 to 2017:

  • The average operating margin decline for analyzed systems was 38.7%. Not-for-profit system margins fell 34%, while for-profit margins fell 39%.
  • 65% of systems experienced operating income declines totaling $6.8 billion, with the most significant reductions occurring in the U.S.’s fastest-growing regions: West/Southwest and South Central.
  • At the root of these declines were multiyear reductions in the rate of topline operating revenue growth, which fell from 7% (2015 to 2016) to only 5.5% (2016 to 2017), and a failure to contain expenses in line with revenue deterioration. 

Navigant cites these drivers of earnings deterioration:

  1. Weakening demand for such core hospital services as surgery and inpatient admissions, due in part to rising patient cost exposure from high-deductible health plans;
  2. Deteriorating collection rates for private accounts in non-ACA expansion states;
  3. Steady erosion in Medicare payment rates due to the ACA and the 2012 federal budget sequester; and
  4. Failure of health system value-based insurance contracts to deliver sufficient patient volume to offset steep upfront payer discounts and significant hospital population health investments.

Meanwhile on the other side of the post-ACA equation, Mark Farrah Associates this week “released an analysis brief providing insights into mid-year profitability for commercial and government lines of health insurance business. MFA compared second quarter, year-over-year profitability for the Individual, Employer-Group, Medicare and managed Medicaid segments.”

They found that:

  • At the end of second quarter 2018, the average medical expense ratio for the Individual segment was 70.8%, as compared to 77.2% the previous year.
  • Growth in premiums pushed the average medical expense ratio for the Employer-Group segment down to 80.9% for 2Q18 from 81.8% in 2Q17.
  • For Medicare Advantage, premium growth outpaced increases in medical expenses pushing the medical expense ratio down to 85.3% from 86.1% in 2Q17.
  • 2.9% increase in premiums per member per month pushed the medical expense ratio for Managed Medicaid down to 88.6% from 91.0% in 2Q17.

Mark Farrah Associates concludes the current outlook is better than the one Navigant finds for health systems: “At the mid-year point, all four health care segments are signifying improved profitability for health insurers over 2017.  The most significant change is once again in the Individual segment showing improvement over 2017, which ended up being a profitable year for the segment overall.  While this analysis of mid-year segment performance sheds light upon profitability trends for 2018, it’s a wait and see proposition until final financial results are revealed in spring of 2019.”

Friday
Aug102018

25 Things to Know About The CMS Medicare ACO Proposed Rule: Pathways to Success

By Clive Riddle, August 10, 2018

Here are 25 major points to note in the CMS Pathways to Success Proposed Rule introduced on August 9th:

  1. The redesigned Medicare Shared Savings program is called “Pathways to Success.
  2. There are five stated goals Pathways to Success is intended to advance: Accountability, Competition, Engagement, Integrity, and Quality.
  3. The CMS projected financial impact of the proposal would be savings to Medicare of $2.2 billion over ten years.
  4. CMS notes that 460 of the 561 or 82% of all ACOs in the Shared Savings Program in 2018 – are not taking on risk for increases in costs.
  5. The amount of time that an ACO can remain in the program with upside-only risk  would be limited to two years (or one year for ACOs identified as having previously participated in MSSP under upside-only risk) instead of the current timetable of up to six years.
  6. A 6-month extension would be provided for current ACOs whose agreements expire at the end of 2018, along with a special one-time July 1, 2019 start date that will have a spring 2019 application period for the new participation options.
  7. The number of tracks would be reduced to two, the “BASIC” track and the “ENHANCED” track, and would allow providers to pick between these two tracks. 
  8. The length of ACO participation agreements would expand from three years to five years.
  9. The BASIC track would feature a glide path for taking risk.  It would begin with up to two years of upside-only risk and then gradually transition in years three, four, and five to increasing levels of performance risk, concluding in year five at a level of risk that meets the standard to qualify as an Advanced Alternative Payment Model (APM) under MACRA. 
  10. Current upside-only ACOs would be limited to one year without risk before being required to transition to the risk level in year three of the glide path.
  11. The ENHANCED track would allow providers to take on risk and qualify as an Advanced APM immediately.  This track would offer the same amount of risk for each of the five years of the agreement period, at a level of risk sharing higher than the maximum amount reached in the BASIC track.
  12. Eligible ACOs (ACOs that are inexperienced with two-sided risk in Medicare) would be able to enter at any level of risk in the BASIC track’s glide path or go straight to the ENHANCED track.
  13. After completing a five-year agreement under the BASIC track, low revenue ACOs would be able to renew for a second agreement period at the highest level of risk in the BASIC track, while high revenue ACOs would be required to move to the ENHANCED track and take on additional risk.
  14. Each ACO would provide a standardized written notice to its Medicare beneficiaries, informing them at their first primary care visit of a performance year that they are in an ACO and what that means for their care.
  15. CMS would allow certain two-sided ACOs to provide an incentive payment of up to $20 to each assigned beneficiary for each qualifying primary care service that the beneficiary receives, as an incentive for taking steps to achieve and maintain good health. 
  16. CMS is seeking comment on an approach that would allow beneficiaries to opt in to an ACO as an alternative to assignment. 
  17. CMS would streamline the measures that ACOs are required to report, to ensure that all measures have a meaningful impact on patient care.
  18. CMS would require a specified percentage of the eligible clinicians participating in an ACO to adopt the 2015 edition of Certified EHR Technology (CEHRT) as part of the Administration’s MyHealthEData initiative promoting interoperability of medical data and patient control of their data.
  19. Physicians in ACOs that take on risk could receive payment for telehealth services provided to patients regardless of the patient’s location.
  20. Regional (county-level) spending would be incorporated into ACO benchmarks starting in their first agreement period.
  21. Methodology for risk adjustment would more accurately account for changes in beneficiaries’ health status.
  22. When calculating and updating benchmarks, CMS would factor in national spending growth rates in addition to regional rates, so ACOs that constitute a large fraction of their local market would not be penalized if they reduce the market growth rate.
  23. ACOs in two-sided models would be accountable for losses even if they exit mid-way through a performance year.
  24. Termination of ACOs with multiple years of poor financial performance would be authorized.
  25. The detailed Medicare Shared Savings Program Notice of Proposed Rulemaking (CMS-1701-P), “Accountable Care Organizations‑‑Pathways to Success,” is available at https://www.federalregister.gov/public-inspection/  and https://www.cms.gov/newsroom/fact-sheets/proposed-pathways-success-medicare-shared-savings-program.


Thursday
Apr122018

Long Term ACO Impact: Medicare vs. Medicaid vs. Commercial

Long Term ACO Impact: Medicare vs. Medicaid vs. Commercial
 

By Clive Riddle, April 12, 2018


Commercial accountable care – value based payment arrangements between purchasers and providers seem to be spreading virally. States Medicaid accountable care initiatives are proliferating.  Will Medicare continue to consumer the greatest share of healthcare stakeholder attributed ACO patients and financial resources?  The April issue of Accountable Care News Thoughtleaders Corner ask a panel this question: “Which type of ACO activity will have more impact on stakeholders in the long term: Medicare, Medicaid  or commercial?”


Kirit Pandit, Co-Founder & Chief Technology Officer of VitreosHealth responds that “I think Medicare ACO activity will have the most impact in the long term based on where incentives are maximized. Fully capitated plans such as Medicare Advantage and managed Medicaid plans will have the highest incentive to reduce costs and maintain high quality scores. This is where ACO activity will produce the best outcomes. The per member per month costs are high to make it attractive for providers to participate in these performance-based contracts.  However, compared to Medicare ACOs, Medicaid has higher churn rates. This makes it challenging for the providers to manage these members with a long-term perspective. If the churn rates are high, chronic care management activities will not have enough time to impact patient behavior and outcome. So the Medicare ACO plans that are fully capitated and have minimal member churn will have the highest impact.”


 Michael Millenson, President, Health Quality Advisors; adjunct associate professor of medicine at Northwestern University’s Feinberg School of Medicine and author of the book Demanding Medical Excellence has this to say: “Right now, it’s synergistic. Medicare is by far the nation's largest payer, but joining an ACO is voluntary. However, Medicare’s clout and standardization are critical. On the other hand, Medicaid and private payers can both push their programs on providers (a state or large employers can choose only ACOs) and be much more innovative. Statutorily, CMS could switch all Medicare to ACOs without additional congressional authorization. If that ever happens – with implicit Congressional approval and definitely in the long term – this question will have answered itself.”     


William DeMarco, Founder and President, Pendulum HealthCare Development Corporation, which has advised a wide range of ACO clients shares that “We think after all the dust settles, Medicare will offer the biggest impact on stakeholders. This considers total dollars and the fact that 10,000 Baby Boomers turn 65 every day and total cost of care will continue to rise ahead of inflation – so it will always be a big number. Medicaid will continue to be in a constant state of change on a state-by-state basis, but will slowly follow the ACO transition that may very well lead to more Special Needs and Dual-Eligible strategies being promoted by states and offered by insurers, as well as provider-led health plans that see the advantage of receiving a large capitated sum from Medicare and Medicaid for eligible patients. I say this based upon the number of Section 1115 waivers being sought to permit states to offer above and beyond Medicaid benefits through ACOs and CCOs. Commercial will always be in transition, as self-funded and fully insured are finding big deductibles do not work and the fiduciary accountability starts to weigh heavily on many of the purchasers of care. What employers are interested in are ACOs that can manage the active workers and retirees at a predictable cost. Health plans and insurers are seeing their profitability is linked with these ACOs that can take partial or full risk for the medical portion of the premium, and this allows the health plan to improve administrative cost savings – plus predict total cost of care.”


So, some collective wisdom seems to point towards Medicare continuing to hold the strongest magnetic force attracting ACO activity.

 
Friday
Jan192018

2018 CMS Medicare Shared Savings Program: 43 Previous ACOs out, 124 New ACOs In

By Clive Riddle, January 19, 2018

CMS recently published 2018 Medicare Shared Savings Program information.  After comparing the listing of 561 2018 MSSP participants to the 480 2017 participants, we found 43 2017 ACOs have exited the program for 2018, and there are 124 new ACOs for 2018.  Caravan Health has sponsored 15 new ACOs, and Community Health Systems is sponsoring 14 of the new ACOs.

Here’s the list for the 43 ACOs exiting the program:

  1. Accountable Care Coalition of Mount Kisco (CT, NY)
  2. Accountable Care Coalition of Western Georgia (AL, GA)
  3. ACO of East Hawaii (HI)
  4. Advanced Premier Physicians ACO (CA)
  5. APCN-ACO (CA)
  6. ApolloMed Accountable Care Organization (CA, FL, HI)
  7. Arkansas High Performance Network ACO of FQHC (AR, KY)
  8. Arkansas HIgh Performance Network ACO (AR)
  9. Bay Area Medical Associates ACO (CA)
  10. Bluegrass Clinical Partners (FL, KY, TN)
  11. Care Covenant (TX)
  12. Catholic Medical Partners-Accountable Care IPA (NY)
  13. CHRISTUS Louisiana ACO (LA)
  14. CHWN ACO (IL)
  15. Collaborative Health ACO (MA)
  16. Community Health Accountable Care (NH, NY, VT)
  17. Connected Care (MI)
  18. Cornerstone Health Enablement Strategic Solutions (NC)
  19. Health Leaders Medicare ACO Network (LA)
  20. Indiana Care Organization (IN)
  21. Kansas Primary Care Alliance (KS, MO)
  22. KCMPA-ACO (KS, MO)
  23. Mary Washington Health Alliance. (VA)
  24. Mercy ACO (AR, MO)
  25. MHT-ACO (GA, MI, OK, SC, TX)
  26. Midwest Quality Care Alliance (KS, MO)
  27. NEQCA Accountable Care, (MA)
  28. North Jersey ACO (NJ, NY)
  29. OneCare Vermont Accountable Care Organization (NH, VT)
  30. Oregon ACO (OR, WA)
  31. Palm Accountable Care Organization (FL)
  32. Physicians Accountable Care Solutions (CA, CO, CT, IL, NY, OH, PA, UT, WV)
  33. Physicians Collaborative Trust ACO (FL)
  34. Primaria ACO (IN)
  35. Primary Care Alliance (FL)
  36. Revere Health (AZ, UT)
  37. Shannon Clinic (TX)
  38. South Shore Physician-Hospital Organization (MA)
  39. SPACO (FL)
  40. Torrance Memorial Integrated Physicians (CA)
  41. UW Health ACO, (WI)
  42. VirtuaCare (NJ)
  43. Western Maryland Physician Network (MD, PA, VA, WV)

And here’s the list of the 124 new ACOs joining the program for 2018:

  1. Accountable Care Coalition of Alabama (AL)
  2. Account. Care Coal. of Community Health Centers (AR, DC, FL, IL, KY, MD, MI, RI)
  3. Accountable Care Coalition of New Jersey (NJ)
  4. Accountable Care of Nevada (NV)
  5. Accountable Care Organization of Aurora (IL, MI, WI)
  6. ACO West Virginia (PA, WV)
  7. Acorn Network (IL, IN, MI)
  8. Adventist Health Accountable Care (CA)
  9. Adventist Health System ACO (FL)
  10. Alabama Physician Network (AL)
  11. Aledade Accountable Care 22 (OH, PA)
  12. Aledade Accountable Care 25 (NJ)
  13. Aledade Accountable Care 35 (LA, MS, TN)
  14. Aledade Accountable Care 37 (MD, TN, VA, WV)
  15. Baptist Health/UAMS Accountable Care Alliance (AR, TX)
  16. Baptist Physician Partners ACO (FL, GA)
  17. Bethesda Health Quality Alliance (FL)
  18. Boulder Valley Care Network (CO)
  19. Bridges Health Partners ACO (PA)
  20. Caravan Health ACO 11 (AL, GA, IL, KY, NM, NV, TX)
  21. Caravan Health ACO 12 (MN, WI)
  22. Caravan Health ACO 13 (MA, NY, VT)
  23. Caravan Health ACO 14 (ID, MN)
  24. Caravan Health ACO 15 (IA, MN, NE, SD)
  25. Caravan Health ACO 16 (AL, TN)
  26. Caravan Health ACO 17 (OR)
  27. Caravan Health ACO 31 (OK)
  28. Caravan Health ACO 32 (OK)
  29. Caravan Health ACO 33 (OK)
  30. Caravan Health ACO 34 (OK)
  31. Carolinas HealthCare System ACO (NC, SC)
  32. Cascadia Care Network (WA)
  33. Centrus Health of Kansas City (KS, MO)
  34. CHSPSC ACO 1 (AL, FL, LA, MS)
  35. CHSPSC ACO 10 (FL)
  36. CHSPSC ACO 12 (GA, NC, SC, VA)
  37. CHSPSC ACO 13 (PA)
  38. CHSPSC ACO 14 (TN, WV)
  39. CHSPSC ACO 15 (KY, TN)
  40. CHSPSC ACO 16 (OK)
  41. CHSPSC ACO 17 (FL)
  42. CHSPSC ACO 2 (IN)
  43. CHSPSC ACO 21 (AL, FL)
  44. CHSPSC ACO 6 (TX)
  45. CHSPSC ACO 7 (AR, LA, MO, OK)
  46. CHSPSC ACO 8 (AK, AZ, NM, NV)
  47. CHSPSC ACO 9 (IN)
  48. Coastal One Health Partners (CA)
  49. ColigoCare (NJ, NY)
  50. Community Health Center Network Of Idaho (ID, OR, WA)
  51. Community Healthcare Partners ACO, (IL, IN)
  52. Connected Care of East Tennessee (AL, GA, TN)
  53. Connected Care of Middle Tennessee (TN)
  54. Connected Care of Mississippi (MS)
  55. Connected Care of West Tennessee (MS, TN)
  56. CPSI ACO 2 (CA, CO, GU, ID, ND, OR, SD, WA)
  57. CPSI ACO 3 (GA, MS, NC)
  58. CPSI ACO 7 (IA, IL, NE, WI, WV)
  59. CPSI ACO 8 (AR, LA, MO, TX)
  60. Crestwood Regional Healthcare Alliance (AL)
  61. CVACC (VA)
  62. DMH Health Network (IL)
  63. DOCACO GULF COAST (FL, SC)
  64. Einstein Care Partners (PA)
  65. Family Choice ACO (CA)
  66. Foothill Accountable Care Medical Group, (CA)
  67. Genesis Physicians Group (TX)
  68. Health Alliance ACO (DC, MD, VA)
  69. Healthcare Quality Partners (NJ, PA)
  70. HealthChoice (AR, MS, TN)
  71. Heritage Valley Healthcare Network ACO (OH, PA, WV)
  72. Holy Name Medical Center ACO (NJ)
  73. HP2 (GA)
  74. Independent Physicians Accountable Care (CA, CT, FL, SC, TX, VA)
  75. Inspire Health Partners (IN)
  76. Intermountain Accountable Care (NV, UT)
  77. Keep Well ACO (IL, KS, MO)
  78. KENNEDY HEALTH ALLIANCE (NJ)
  79. Kootenai Accountable Care (ID, WA)
  80. McFarland Clinic, PC (IA)
  81. McLeod Healthcare Network (NC, SC)
  82. MHC Accountable Care Organization (KY, OH, WV)
  83. MHN ACO (IA, IL, NE, SD)
  84. MSHP ACO (NY)
  85. MultiCare Connected Care (WA)
  86. NCH ACO (FL)
  87. NorthShore Physician Assoc. Value Based Care (IL)
  88. OhioHealth Venture (OH)
  89. Orange Accountable Care Organization (FL, MD, NJ, NM, PA, TX)
  90. Pacific Private Practice Network, Inc (CA, TX)
  91. PathfinderHealth (AZ)
  92. Physician Partners of Western PA (PA)
  93. Physician Performance Network of Arizona (AZ)
  94. Primary Comprehensive Care ACO (IL, NC)
  95. PRIMARY PARTNERS (FL)
  96. PRIME ACCOUNTABLE CARE WEST (AZ, CA, IL, NV)
  97. Privia Quality Network Gulf Coast II (TX)
  98. QHI ACO (CA, CT, IL)
  99. Renaissance Physicians Accountable Care (TX)
  100. Riverside Health Source (VA)
  101. Rush Health ACO (IL)
  102. Saint Francis Hospital Medicare ACO (AR, IL, MI, MS, TN)
  103. Select Physicians Associates (AL, FL)
  104. SIGNATURE NETWORK (VA)
  105. Space Coast Independent Practice Association (FL)
  106. St. Dominic Medical Associates (MS)
  107. St. Luke's ACO (IL, MO)
  108. St. Luke's Medicare ACO (NJ, PA)
  109. St. Tammany Hospital ACO (LA)
  110. Steward National Care Network, (FL, MA, NJ, OH, PA)
  111. The Iowa Clinic, P.C. (IA)
  112. The Ohio State Health ACO (OH)
  113. Treasure Coast Integrated Healthcare (FL)
  114. UC Davis Health ACO (CA)
  115. UC Irvine Health Accountable Care Organization (CA)
  116. UC San Diego Health Accountable Care Network (CA)
  117. UCSF Health ACO (CA)
  118. UMC Accountable Care (NM, TX)
  119. United Physicians ACO (MI)
  120. University Health ACO (TN)
  121. UPQC (NV, UT)
  122. Valley Medical Group-Renton (WA)
  123. VillageMD Chicago ACO (GA, IL, IN, KY, TN)
  124. White River Health System Clinically Int. Network (AR)
Friday
Nov032017

Three Recent Studies and Three Different Perceptions of Value Based Payments

Three Recent Studies and Three Different Perceptions of Value Based Payments
 

by Clive Riddle, November 3, 2017


Three different recently released studies addressing value based payments fuel three different perceptions: (1) value based payments have solid momentum; (2) that hospitals view value based care is growing more slowly than anticipated; and (3) physicians prefer FFS systems to value based care.


The Health Care Payment Learning & Action Network has just released a report with survey results indicating “29% of total U.S. health care payments were tied to alternative payment models (APMs) in 2016 compared to 23% in 2015, an increase of six percentage points.” The Network states that “the survey collected data from over 80 participants, accounting for nearly 245.4 million people, or 84%, of the covered U.S. population.”  


While 29% of payments were value based and totaling “approximately $354.5 billion dollars nationally” in 2016, the Network determined that 43% of payments were “traditional FFS or other legacy payments not linked to quality” and 28% was “pay-for-performance or care coordination fees.”


Deloitte recently released results from their 2017 Survey of US Health System CEOs which includes are chapter on Population health and value-based care that provides these insights:

·         “Survey participants say the transition to value-based care is happening, but at a slower rate than initially anticipated. Still, many of the CEOs report that they are developing and expanding innovative delivery and payment models, and are focusing on MACRA and physician activation.

·         “Many CEOs also are looking into strategies to generate physician buy-in and encourage behavioral change, which will help them be better prepared for the transition to population health and value-based care.”

·         “Many of the surveyed CEOs express concern about operating under two different payment systems—FFS and value-based care—and having misaligned incentives. Moreover, moving towards population health and bearing financial risk likely will require a large patient population.”

·         “Many CEOs who previously had acquired and invested in physician practices report being more engaged and prepared for MACRA implementation than other survey respondents. “

·         “In our survey, some respondents indicate they are using tools including clinical integration, employment contracts with incentives, ACOs and risk-sharing agreements, among others to better activate physicians in care delivery transformation.”


Meanwhile, Bain & Company recently released their Front Line of Healthcare Report 2017, in which they surveyed 980 physicians and concluded that “more than 60% of the physicians we surveyed believe it will become more difficult to deliver high-quality care in the next two years as they struggle to cope with a complex regulatory environment, increasing administrative burdens and a more difficult reimbursement landscape. After years of experimentation, physicians now want evidence that new models for care management, reimbursement, policy and patient engagement will actually improve clinical outcomes. Without it, they see little reason to alter the status quo and move toward widespread adoption.”


Specific to physician receptivity toward value based care, Bain found that physicians very much prefer FFS if they had their druthers: “More than 70% of physicians prefer to use a fee-for-service model, citing concerns about the complexity and quality of care associated with value-based payment models. Fifty-three percent of physicians say that capitation reduces the quality of care, and most see little advantage from pay-for-performance models either. Further, many believe their organizations are not sufficiently prepared for the shift to value-based care.”

 
Friday
May052017

Different Approaches in Tackling the Surprise Medical Bill Problem

Untitled 1
 

By Clive Riddle, May 5, 2017


Surprise medical bills – from out of network physicians affiliated with network hospitals, and other similar situations – have been a long standing problem vexing consumers, providers, plans, employers and regulators. This simmering issue began boiling over the past few years as growth in narrow networks and ever increasing retail charges exacerbated the problem.


Arizona last week had Senate Bill 1441 signed into law: “The legislation, which takes effect in 2019, will allow a consumer with an out-of-network bill exceeding $1,000 to contact the Arizona Department of Insurance to request the appointment of an arbitrator. The insurer and health-care provider must try to settle the dispute through an informal telephone conference within 30 days of the consumer's arbitration request. The case advances to arbitration if the two sides cannot agree to an amount, with the insurer and health-care provider splitting the cost. Either party would have the right to appeal an arbitrator's decision to the county Superior Court.”


Oregon, Texas and Nevada, to name some states, currently have legislative activity of different kinds on this front.


Gastroenterology & Endoscopy News ran a nice April 20th 2017 article, Out-of-Network Billing: ‘Surprise Billing’ or ‘Surprise Gaps In Insurance Coverage’? that included a great summary of state level initiatives addressing these surprises.  Included in this discussion was:

·         A number of states are linking reimbursement to rates determined by the independent third-party database.

·         In New York  “Hospitals must disclose which health plans they accept and list standard charges for services. Perhaps most important, they must alert patients that physicians working at an in-network facility may not actually participate in the insurance network and can therefore bill patients directly.”

·         “California recently passed a law that settles out-of-network billing disputes by using one of two benchmarks. Providers will be reimbursed the greater of either 125% of Medicare rates or the insurer’s average contracted rate for the same or similar services in the same geographic region.”…but “not surprisingly, the California law is already being challenged in court.”

·         “Florida’s new law sets reimbursement for out-of-network claims at the lesser of: the provider’s charges; the UCR provider charges for similar services in the community where the services were provided; or the charge mutually agreed to by the insurer and the provider within 60 days of the submittal of the claim. The key in Florida moving forward will be how UCR is defined.”


The American Journal of Managed Care  has just issued a release discussing an article in their current issue: Battling the Chargemaster: A Simple Remedy to Balance Billing for Unavoidable Out-of-Network Care, in which “two doctors and two lawyers say they have a solution that doesn’t require legislation: better use of contract law…..Authors Barak D. Richman, JD, PhD; Nick Kitzman, JD; Arnold Milstein, MD, MPH; and Kevin A. Schulman, MD, say the problem starts with the ‘chargemaster,’ a hospital’s master list of prices for billable services. The authors say the defining feature of the chargemaster is that it is ‘devoid of any calculation related to cost,’ and has no relation to local market conditions.”


They release continues that “acontract law solution empowers the very parties who currently are being exploited by out-of-network charges,” they write. An emerging consensus, supported by a key court ruling, finds that providers are not entitled to ‘chargemaster’ rates, because neither the patient nor the payer agreed to them. Instead, the authors write, the law “entitles providers to collect no more than the prevailing negotiated market prices” for out-of-network care. In other words, rates already negotiated by hospitals, doctors, and area payers are the norm, not those artificially inflated on the ‘chargemaster.’ This leads to a stark conclusion, the authors find. ‘Providers have no legal authority to collect chargemaster charges that exceed market prices for out-of-network services, nor are payers under any obligation to pay such chargemaster prices.’ The authors make their case in a legal analysis available online.”


So while “the authors praise state legislators for trying to end surprise medical bills, they say the courtroom is the proper place for these disputes. Other remedies, like bans on out-of-network bills, don’t encourage cost-saving steps or competition.”

 
Friday
Jan202017

2017 MSSP ACOs By The Numbers

by Clive Riddle


CMS has announced their 2017 new and renewing ACOs, so we took a somewhat deeper dive into what comprises this year’s MSSP ACO roster, along with who dropped out. For starters, though, here’s the 2017 totals including the other active ACO types (there are also 9 remaining ACOs in the non-active Pioneer model):

  •          MSSP - 480
  •          Next generation - 45
  •          Comprehensive ESRD (CEC) – 47
  •          Total: 572


52 MSSP ACOs participating in 2016 dropped out of the program for 2017. 8 of these started in 2012, 11 in 2013, 22 in 2014, 8 in 2015, 3 in 2016.


For the 480 MSSP ACOs participating in 2017, with respect their track:

  •          Track 1 – 438
  •          Track 2 – 6
  •          Track 3 – 36


17 of these ACOs remain in the non-active Advance Payment program. 45 of these ACOs are the AIM program, and 25 are in the SNF 3 day waiver program.


With respect to geography, when classifying the MSSP ACOs by the primary state they serve (many ACOs serve markets in more than one state), 16 states comprise over two-thirds (68%) of the total:

  •          FL 44 ACOs
  •          TX 44 ACOs
  •          NY 34 ACOs
  •          CA 25 ACOs
  •          MI 20 ACOs
  •          NJ 19 ACOs
  •          NC 18 ACOs
  •          IL 17 ACOs
  •          GA 15 ACOs
  •          IN 15 ACOs
  •          MD 14 ACOs
  •          OH 14 ACOs
  •          KY 13 ACOs
  •          VA 13 ACOs
  •          PA 12 ACOs
  •          MA 11 ACOs


With respect to their initial year joining the program, MSSPs break down as follows:

  •          2012: 49 ACOs (14%)
  •          2013: 63 ACOs (13%)
  •          2014: 79 ACOs (16%)
  •          2015: 77 ACOs (16%)
  •          2016: 97 ACOs (20%)
  •          2017: 99 ACOs (21%)
Friday
Dec022016

Focus on Value to Survive, Maybe Flourish, for Next Four Years

by Clive Riddle, December 2, 2016

What shall be the fate of value-based care initiatives in the wake of a new administration’s zeal to slash away at all thing Affordable Care Act? The following article: Focus on Value to Survive, Maybe Flourish, for Next Four Years, recently appeared in the Inaugural issue of Value-Based Payment News, Russell Jackson, editor:

The quadrennial change of who’s who in the nation’s capital generally brings with it a shift in focus at the federal regulatory agencies and a reboot of the dynamic between the White House and the Capitol. But despite the magnitude of change that could reverberate throughout the national-level political apparatus this time around, experts pretty much agree that the value- and quality- and other payment reform-related programs – the Medicare Access and CHIP Reauthorization Act included – will likely continue in much their current form, albeit, in some cases, under different names and with, in all likelihood, different, and surprising, claims of original ownership.

Don’t be surprised, in other words, if a newly named Centers for Medicare and Medicaid Innovation turns out to have been the new president’s idea all along. Here’s a sampling of what the policy experts have been telling the press about value-based healthcare programs for the next four years.

“Premier Senior Vice President Blair Childs says Republicans strongly support Accountable Care Organizations. ‘They first ran the ACO demonstrations under the Bush Administration,’ he said by email. ‘They are envisioned in MACRA, of which the Republicans are strong supporters.’”

== ‘Republicans Expected to Spare ACOs, Other Demos from ACA Repeal;’ http://insidehealthpolicy.com/

“Ian Spatz, a senior advisor at Manatt Health, said there is no reason to think Republicans would reverse the trend toward providers sharing risk. He said ACOs and other demonstrations that move away from the fee-for-service system are not partisan. However, Spatz said it’s likely that Republicans will place restrictions on CMMI, such as prohibiting mandatory demonstrations, and they might change the Centers’ name.”

== same article

Gilberg, senior vice president of government affairs for the Medical Group Management Association, said they are advising members to continue preparation for MACRA. ‘We don’t see that that is going to be repealed. It was bipartisan, nearly a unanimous vote.’”

== ‘MACRA will move forward largely untouched when Trump steps in, experts say;’ http://www.healthcarefinancenews.com/news/macra-will-move-forward-largely-untouched-when-trump-steps-experts-say

 “Christopher Kerns, managing director at The Advisory Board, said, ‘MACRA is not in trouble, but mechanisms by which they control spending could change.’ Kerns said there might be a shift away from ACOs as a principal driver of controlling spending, and more toward bundled payments or price controls, cuts or other forms of utilization control in the form of reduction in reimbursement for different kinds of services.”

== same article

“The American Academy of Family Physicians said [it doesn’t] believe MACRA as a whole is in any real danger of repeal. ‘The election of Mr. Trump will have a limited impact on the MACRA law in the short-term,’ said AAFP President John Meigs Jr. ‘Looking forward, this law was supported by 91% of Congress. Based on the bipartisan support, it is difficult to see how there would be any fundamental changes under the Trump Administration.’”

== same article

“’This is a movement that’s happening independent of the ACA, or parallel to it,’ said David Jones, an assistant professor of health law, policy and management at Boston University’s School of Public Health. ‘It’s very unclear when they say they’re going to repeal ObamaCare whether they’re even thinking about things like CMMI or to shift away from things like fee-for-service.’”

== ‘Will value-based payment initiatives continue under Trump?;’ http://www.modernhealthcare.com/article/20161111/MAGAZINE/161109907

On the other hand …

“House Budget Chair Rep. Tom Price (R-GA) has had CMMI in his sights for a while now, and Sen. Orrin Hatch (R-UT) is no big fan. Both claim the center lacks accountability and hasn’t shown clear results. They may try to eliminate mandatory CMMI payment models and could seek to legally trim its sails.”

== ‘CMS CMMI, ONC and AHRQ preparing to take hits;’ https://www.g2xchange.com/statics/cms-cmmi-onc-and-ahrq-preparing-to-take-hits


You can request a sample copy of Value-Based Payment News by going here: http://valuebasedpaymentnews.com/sample.html

Friday
Oct282016

How to Increase Physician Engagement in Value Based Care: Deloitte Survey

By Clive Riddle, October 27, 2016

HHS, commercial health plans, states and health systems continue to advance value based care initiatives at a rapid and accelerating pace. But the question is, as the value based train is leaving the station, are the doctors on board?

Deloitte has released a report: Practicing Value-Based Care, which aims to answer the question “What do doctors need?” based on results from their Deloitte Center for Health Solutions 2016 Survey of U.S. Physicians.

The problem for physicians, Deloitte’s Mitch Morris tells us, is “today there is little incentive for them to change; many are still being paid under fee-for-service models and they're not equipped with tools that could help them deliver high-value care."

The Deloitte physician survey “found that while 3 in 4 physicians have clinical protocols, only 36 percent have access to comprehensive protocols (i.e., for many conditions). Also, only 20 percent of physicians receive data on care costs.”

Additionally, Deloitte findings from the survey indicate financial incentives haven’t changed enough: “Eighty-six percent of physicians reported being compensated under fee-for-service (FFS) or salary arrangements, similar to 2014. Showing no change from 2014, one-half of physicians reported performance bonuses less than or equal to 10 percent of their compensation, and one-third were ineligible for performance bonuses.”

Deloitte advocates that public and private stakeholders should partner with doctors to accomplish three things that would greatly enhance physician engagement:

  1. Tie at least 20% of physician compensation to performance
  2. Equip physicians with the right tools to help them meet performance goals including “clinical protocols, quality measures that align with their specialties and emphasize outcomes rather than processes of care, and detailed data on their own performance and on physicians to whom they refer patients.”
  3. Invest in technology capabilities to connect and integrate the tools
Friday
Aug262016

EpiPens By The Numbers

by Clive Riddle, August 26, 2016

Without wading into the policy, prognostication, editorial or other narrative issues surrounding Mylan’s EpiPen pricing controversy, here simply is a collection of selected relevant data compiled related to all that is Mylan EpiPen:

Friday
Jul082016

How much of a game-changer is MACRA and the MIPS and APM paths?

By Clive Riddle, July 8, 2016

That is the question asked of panelists in the current edition of MCOL’s ThoughtLeaders. Here, in its entirety, is a response from one of the panel: Mark E. Lutes, Chair, Board of Directors / Member of the Firm, at Epstein Becker Green.  Actually, here’s the question posed in its entirety: “How much of a game-changer is MACRA and the MIPS and APM paths going to be for Medicare, and will Medicaid or Commercial programs adopt similar approaches for applicable segments?”

So here’s what Mark had to say in response:

MACRA represents a laudable attempt to replace the truly failed SGR with an approach that seeks to do the right thing, which is to reward quality and efficiency at the individual practice level. Though it has some challenges and, like most major policy changes, will require plenty of tweaking once implemented in real world situations. MACRA is likely to be a game changer but, as per usual, not in the direct ways that Congress/CMS may have anticipated or hoped.  Thus, MACRA, like HiTech and dozens of other pieces of legislation before it, is most likely to illustrate that the "law of unintended consequences" is the most predictable result of Washington DC legislative and regulatory action.

A few illustrations-the availability of the APM v the MIPS pathway was hoped to induce more rapid adoption of risk assuming payments.  If CMS had seen fit to provide more of a glide path toward APM qualification, the "brass ring" of Medicare payment increases via APM qualification might well have "lit a fire" under segments of the provider community seeking to avoid the uncertainties of MIPS based fee schedule increases.  However, the draft rule puts that brass ring out of reach for most medical groups, ACOs, IPAs, and PHOs.  Thus, one of the key "game changing" opportunities of MACRA is likely to be missed.  As it did with ACOs, where it demanded provider investment to produce savings that benefited the Medicare program and then put limits on the providers' opportunity to garner the reward for their efforts, CMS is in danger of missing the golden opportunity to incent a stampede toward APMs by making the "perfection" in risk assumption the enemy of the "good" in the way of progress towards that end.

In fact, in the proposed rule, CMS averts its eyes from the efforts of many physicians to achieve value through managed care programs. The rule only gives credit for activities physicians are conducting in the fee-for-service realm. One thing to watch is a report CMS is due to issue by July 1 as required by Section 101(e)(6) of MACRA on the feasibility of integrating the APM concept in the Medicare Advantage payment system. And, unfortunately, there's no credit given for non-Medicare APM activity until 2021.   

Likewise, because MIPS allows providers a great deal of choice in metrics upon which to be measured, it will not drive change across other payor streams.  There are too many choices for other payors to expect that their provider networks will be geared up to report any particular subset around which financial incentives might be built.  It may be more realistic to hope that consensus, adoptable in a range of payment programs will come instead out of the joint payor/CMS work in the Health Care Payment Learning & Action Network (LAN).

In several years, looking back on the run-up to the payment impacts, MACRA is likely to be seen to have been a game changer-in two ways that are not within the story line.  First, MACRA is likely to be regarded as an instigating event in physician practice consolidation, through the expansion of hospital employment, insurer physician practice transactions, specialty group growth and physician practice Management Company ventures 2.0.  Even if the individual MIPS measures are viewed by individual and small groups of physicians as doable in the near term, there will be mental energy burned to comprehend them, software upgrades to support their reporting, and there will be a growing fear of the unknown as the resource use measures evolve.  Therefore, probably the most predictable and predominate result of MACRA will not be the instigation of quality improvement and enhanced attention to resource use which the federal government intends, but another "nail in the coffin" of small scale medical practice.

Second, MACRA is likely to be regarded as a watershed moment wherein the fee-for-service Medicare program took on (or even exceeded in granularity) the incentives present in managed care.  Previously, a physician practice opted in to payment for performance.  PQRS and meaningful use had been, to date, largely reporting incentives and ACO downside risk was both voluntary and relatively rarely attempted.  The dawn of MACRA might be seen as CMS crossing the line from being a passive payor to being a demanding customer that changes the specifications of its order and settles it bill according to data it controls well after the date of service.

Note: Mark will be participating in the faculty in a webinar on this topic, along with EBG's Lesley Yeung and EBG Advisors' Bob Atlas in the HealthcareWebSummit event on Thursday August 4th, 2016 at 1 PM Eastern : Preparing for MACRA - The Next Steps: Composite Scoring, Performance Considerations, Implications and More.