Search

Entries in Data & Technology (97)

Friday
Mar252022

ARPA-H Needs to Think Bigger

By Kim Bellard, March 25, 2022

Everyone loves DARPA, the Defense Advanced Research Projects Agency that is credited with such hits as the internet and GPS, but is also responsible for things like the Boston Dynamics back-flipping robots and even Siri.  

Healthcare is, at long last, getting its own DARPA, with ARPA-H (Advanced Research Project Agency for Health).  It’s been discussed for years, but just last week was finally funded; a billion dollars over three years.  But I fear it is already off on the wrong foot, even ignoring the fact that President Biden had requested $6.5b. 

Let’s start with the problem that it not only doesn’t have a leader yet, but it doesn’t even have a home.  More worrisome, though, is that, according to President Biden, “ARPA-H will have a singular purpose: to drive breakthroughs in biomedicine.”   The mission wasn’t originally that limited, but priorities like the “cancer moonshot” tend to focus emphasis. Biomedicine isn’t going to solve all of our health and healthcare problems.

Take, for example, the developing fiasco that is the replacement VA EHR.  Decades ago the VA developed VistA, one of the first attempts at an EHR, but during the Trump Administration it was decided to move to a commercial EHR.  Cerner won the bid.  According to three reports issued by the VA Inspector General last week about the first implementation, it is not going well, to say the least. 

Now, I’m not intending to pick on Cerner – its DoD EHR rollout seems to be doing better – or advocating for VistA. I don’t want ARPH-A to help invent a new and improved EHR.  I want them to help invent the technology that is to EHRs as EHRs are to paper records.  I want a big leap.

I want the next generation of health information technology, allowing people to store, share, exchange, and use key health information, making all that look easy – like magic.  I want technology that may not become mainstream until 2050, but which would still be useful in 2100.

I don’t know what technologies will be important to that. Maybe holograms, maybe digital twins, maybe DNA storage, maybe blockchain/Web3, maybe AI, maybe quantum computing.  Maybe all of those, and others.  The important thing is, think big enough.  About this problem, and others.

We should be looking at breakthrough technologies that get at health in our everyday lives.  How do we track it, how do we foster it, how do we improve it where we live?    Those are the kinds of thing ARPA-H needs to help develop.

DARPA’s projects can take 20-25 years to reach commercial viability – if they ever do.  We can’t afford to think too short-term (e.g., anything less than 10-15 years) or too narrowly (e.g., only biomedicine). When we think about ARPA-H projects, we should thus be thinking about what we want to our health and our healthcare system to be in 2050. 

I hope the VA EHR recovers from its stumbles.  But wishing and hoping isn’t getting us where we need to be; we need breakthroughs. 

Based on DARPA’s experience, it’s not important that the leader be a visionary.  We don’t need a Steve Jobs or Elon Musk.  We need a leader who can separate the crazy from the wild, who welcomes that wild, and who knows how to get out of the way of innovators trying to make the wild plausible.   

If what we’re debating is whether ARPA-H should be in or out of NIH, we’ve missed the point.  If we’re focusing ARPA-H on biomedicine, we’re missing the opportunities.  If we’re just trying to avoid more catastrophic failures, we’re having one.

Think bigger.  

This post is an abridged version of the original posting in Medium. Please follow Kim on Medium and on Twitter (@kimbbellard)  

Friday
Dec102021

The State of Telehealth as We Slide into 2022

By Clive Riddle, December 10, 2021

A HHS 34-page study released this week by ASPE (Office of the Secretary for Planning and Evaluation) entitled Medicare Beneficiaries’ Use of Telehealth in 2020: Trends by Beneficiary Characteristics and Location says the bottom line on telehealth in the first year of the pandemic was “Medicare telehealth flexibilities mitigated declines in in-person visits during the pandemic in 2020, but there is also evidence of disparities by race/ethnicity and for rural populations.”

The ASPE report found that “the share of Medicare visits conducted through telehealth in 2020 increased 63-fold, from approximately 840,000 in 2019 to 52.7 million. States with the highest use of telehealth in 2020 included Massachusetts, Vermont, Rhode Island, New Hampshire and Connecticut. States with the lowest use of telehealth in 2020 included Tennessee, Nebraska, Kansas, North Dakota and Wyoming.”

Other key findings included:

  • Despite the increase in telehealth visits during the pandemic, total utilization of all Medicare FFS Part B clinician visits declined about 11% in 2020 compared to levels in 2019.
  • Most beneficiaries (92%) received telehealth visits from their homes, which was not permissible in Medicare prior to the pandemic.
  • Prior to the pandemic, telehealth made up less than 1% of visits across all visit specialties but increased substantially in 2020. Telehealth increased to 8% of primary care visits, while specialty care had smallest shift towards telehealth (3% of specialist visits).
  • Visits to behavioral health specialists showed the largest increase in telehealth in 2020. Telehealth comprised a third of total visits to behavioral health specialists.
  • While data limitations preclude clear identification of audio-only telehealth services, up to 70% of these telehealth visits during 2020 were potentially reimbursable for audio-only services.
  • Black and rural beneficiaries had lower use of telehealth compared with White and urban beneficiaries, respectively. Telehealth use varied by state, with higher use in the Northeast and West, and lower in the Midwest and South.

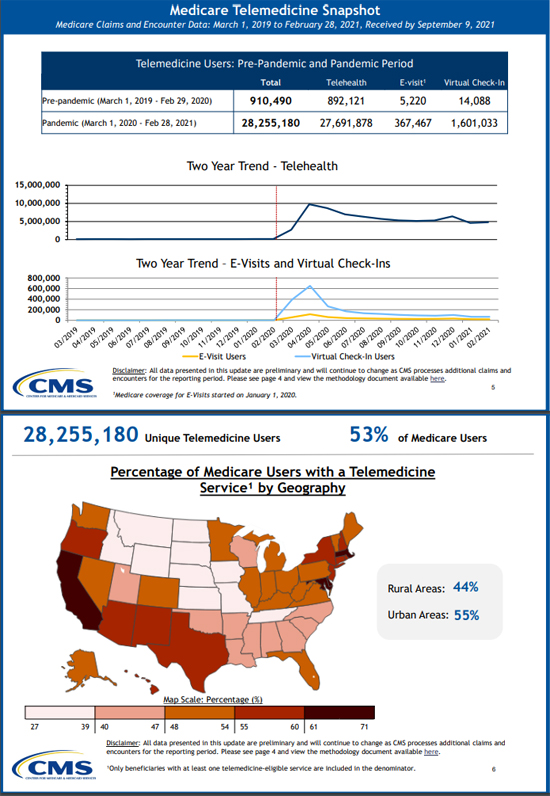
At the same time, CMS released a Medicare Telemedicine Data Snapshot Overview, highlighting claims data between March 1, 2020 and February 28, 2021. In the CMS telemedicine world, they provide these definitions of services that they summarize in their snapshots:

  • Telehealth Visits: Routine office visits provided via video (requires synchronous, real-time audio and/or video communication) with new or established patients. In this snapshot, we group audio-only telehealth in this service category.
  • Virtual Check-ins: Short patient-initiated communications with a healthcare practitioner via telephone or other telecommunications device to decide whether an office visit or other service is needed.
  • E-visits: Non-face-to-face patient-initiated communications with a healthcare practitioner through an online patient portal.

Here’s a peek at two of the seven sections they provide in the overview; they also provide a link to the entire data snapshot file:

Last week, RAND released a new study published in JAMA:   Assessment of Patient Preferences for Telehealth in Post–COVID-19 Pandemic Health Care, which ‘found that people who preferred video visits were more sensitive to out-of-pocket costs than those who preferred in-person visits, as a $20 increase in cost was associated with more people switching from video visits to in-person care.”

RAND reports that “when faced with a choice between an in-person visit or a video visit for a nonemergency health issue, survey participants generally preferred in-person care. Those who were younger, had higher incomes, and had more education were more likely to opt for video visits. Experience with telehealth was associated with a preference for future video visits. Just 2% of those who previously had a video visit were unwilling to do so again…. About 34% of participants did not see any role for video visits in their medical care. These people were generally older, had lower incomes, lived in more-rural areas, and had lower education levels.”

Last month, GoodRx, in collaboration with the American Telemedicine Association released a new report: The State of Telehealth, examining the role the COVID-19 pandemic has played in reshaping virtual care and patient-provider interactions. The report is based on a survey of over 1,000 patients and more than 600 healthcare providers. The key takeaways summarized in their report are:

  1. The COVID-19 pandemic spurred telehealth use, and now both consumers and healthcare providers find value in virtual visits. Both report increased interaction and better outcomes.
  2. Many consumers find value in a hybrid model of care, which combines both in-person visits and telehealth.
  3. No-show rates for telehealth visits may be a pitfall for providers.

Other findings in their report included:

  • About 40% of consumers reported they interacted more with providers because of telehealth appointments
  • 40% of consumers noted that they spend more time with their providers
  • Over 70% of providers said continuity of care was better or much better with telehealth
  • More than 40% of providers reporting it was better than in-person care
  • Before the pandemic, 17% of consumers had used telehealth
  • Now, over 60% of consumers plan on using a hybrid model that combines in-person and telehealth visits
  • More than 80% of providers plan to continue offering telemedicine to patients
  • 60% of providers said telehealth has improved medication adherence and resulted in better conversations about healthcare costs with patients
  • 45% of providers indicated that no-show rates for telehealth appointments were higher or much higher than that of in-person rates
Thursday
Aug262021

I Am Dr. Groot

By Kim Bellard, August 26, 2021

All I can think about is robots. Most of the recent publicity about robots has come from Elon Musk’s announcement of the Tesla Bot, or the new video of Boston Dynamic’s Atlas doing more amazing acrobatics, but I was more intrigued by Brooks Barnes’s New York Times article Are You Ready for Sentient Disney Robots?

One of the things that Disney has long included in its parks’ experience were robots. It has had robots in its parks since the early 1960’s, when it introduced “audio-animatronics,”. Disney has continued to iterate its robots, but, as Mr. Barnes points out, in a world of video games, CGI, VR/AR, and, for heaven’s sake, Atlas robots doing flips, its lineup was growing dated.

Enter Project Kiwi.

In April, Scott LaValley, the lead engineer on the project, told TechCrunch’s Matthew Panzarino: “Project KIWI started about three years ago to figure out how we can bring our smaller characters to life at their actual scale in authentic ways.” The prototype is Marvel’s character Groot, featured in comic books and the Guardians of the Galaxy movies.

By 2021, they had a functioning prototype. Mr. Barnes reported that his interactions with the would-be Groot were quite remarkable. It spoke to him, reacted to his initial non-response, and, eventually, “I wanted to hug him. And take him home.”

Groot is only the beginning. Mr. Barnes said: He is a prototype for a small-scale, free-roaming robotic actor that can take on the role of any similarly sized Disney character. In other words, Disney does not want a one-off. It wants a technology platform for a new class of animatronics.

If, as Elon Musk believes, “the economy is, at the foundation, labor,” then there may be no sector in which this is more true than in healthcare (especially long term care). Tech companies may be failing in healthcare because they think adding a tech layer will “fix” things, but our current system isn’t going anywhere until we address labor — its costs, its supply limitations, its productivity output. The pandemic almost broke our healthcare workers last year, and the recent surge is overwhelming them again.

Healthcare could use more robots.

Yes, there are robots in healthcare. People often point out to robotic surgery, which has not managed to reduce costs, improve quality, or remove the human component. There are also delivery robots (often used in hospitals), “patient simulators,” even companions, but, honestly, we need more robots like Hanson Robotics’ Grace, specifically aimed for healthcare. “I can visit with people and brighten their day with social stimulation … but can also do talk therapy, take bio readings and help healthcare providers,” Grace “told” Reuters.

It’s not there yet; it would need considerable evolution to play a significant role in our healthcare system, but, with the right investments, it will get there. And, yes, eventually there will be robot doctors, powered by AI.

Mr. Panzarino brings up the field of human-robot interaction (HRI), and asserts that, of all the companies, industries, and academic centers working on it, “the most incredibly interesting work in this space is being done in Imagineering R&D.” Again, as the Disney Institute preaches, focusing “on the details that other organizations may often undermanage — or ignore.”

I wish healthcare was leading HRI.

Healthcare needs to change its customer experience from passive to interactive. If Disney recognizes the need to stay “fresh and relevant,” that is all-the-moreso in healthcare. Healthcare thinks it is in the care business, but it must also recognize it is in the experience business — and that its experience currently is pretty woeful (often literally). It’s undermanaging and often ignoring the details that make up that experience. And when does technology in healthcare ever “disappear”?

Robots alone aren’t going to change all that in healthcare, but the level of attention — to detail, to relevancy, to customer experience — that Disney brings to its robotics efforts could go a long way.

 This post is an abridged version of the original posting in Medium. Please follow Kim on Medium and on Twitter (@kimbbellard) 

Tuesday
Jun292021

Go Ahead, A.I. — Surprise Us

By Kim Bellard, June 29, 2021

Last week I was on a fun podcast with a bunch of people who were, as usual, smarter than me, and, in particular, more knowledgeable about one of my favorite topics — artificial intelligence (A.I.), particularly for healthcare. With the WHO releasing its “first global report” on A.I. — Ethics & Governance of Artificial Intelligence for Health — and with no shortage of other experts weighing in recently, it seemed like a good time to revisit the topic.

My prediction: it’s not going to work out quite like we expect, and it probably shouldn’t.

WHO’s proposed six principles are: 

  • Protecting human autonomy
  • Promoting human well-being and safety and the public interest
  • Ensuring transparency, explainability and intelligibility
  • Fostering responsibility and accountability
  • Ensuring inclusiveness and equity
  • Promoting AI that is responsive and sustainable 

All valid points, but, as we’re already learning, easier to propose than to ensure. Just ask Timnit Gebru. When it comes to using new technologies, we’re not so good about thinking through their implications, much less ensuring that everyone benefits. We’re more of a “let the genie out of the bottle and see what happens” kind of species, and I hope our future AI overlords don’t laugh too much about that.

The example that I’ve been using for years is that we can’t even agree on how human physicians seeing patients in other states via telehealth should be licensed/regulated, so how are we going to decide how a cloud-based healthcare A.I. should be?

AI is going to evolve much more rapidly than other healthcare technologies, and our existing regulatory practices may not be sufficient, especially in a global market (as we’ve seen with CRISPR). Not to be facetious, but we may need AI regulators to oversee AI clinicians/clinical support, just as we may need AI lawyers to handle the inevitable AI-related malpractice suits. Only another black box may be able to understand what a black box is doing.

I worry that we’re thinking about how we can use A.I. to make our healthcare system do more of the same, just better. I think that’s the wrong approach. We should be going to ground principles. What do we want from our healthcare system? And, then, how can A.I. help get us there?

If A.I. for healthcare is a better Siri or a new decision support tool in an EHR, we’ve failed. If we’re setting the bar for A.I. to only support clinicians, or even to replicate physicians’ current functions, we’ve failed. We should be expecting much more.

E.g., how can we use A.I. to democratize health care, to get advice and even treatment in people’s hands? How can we use it to help health care be much more affordable? How can A.I. help diagnose issues sooner and deliver recommendations faster and more accurately?

In short, how can A.I. help us reorient our health care from the healthcare system that delivers it, and the people who work in it, to our health? If that means making some of those irrelevant, or at least greatly redefining their roles, so be it.

Right now, much A.I. work in healthcare seems to be focused primarily on granular problems, such as diagnosing specific diseases. That’s understandable, as data is most comparable/available around granular tools (e.g., imaging) or conditions (e.g., breast cancer). But our health is usually not confined within service lines. We need more macro A.I. approaches.

We might need A.I. to tell us how A.I. can not just improve our healthcare but also to “fix” our healthcare system. And I’m OK with that.

This post is an abridged version of the original posting in Medium. Please follow Kim on Medium and on Twitter (@kimbbellard) 

Wednesday
Apr282021

Healthcare’s Million Dollar Blocks

by Kim Bellard, April 28, 2021

Since I first heard about them, I have been fascinated, and dismayed, by the concept of “million dollar blocks.” For those of you unfamiliar with the term, it doesn’t refer to, say, Beverly Hills. No, it refers to city blocks for which society spends over a million dollars annually to incarcerate residents of that block.

I, of course, have to think about the healthcare parallels.

The concept dates back many years, credited to Eric Cadora, now at Justice Mapping, and Laura Kurgan, a professor of architecture at Columbia University, where she is the Director of the Center for Spatial Research (CSR). The power of the concept is to use data visualization to illustrate the problem.

But if, as they say, a picture is worth a thousand words, then perhaps data visualization is worth a million dollars. Even hardened criminal justice advocates have to blanche at how spending is so often concentrated in certain blocks, and should wonder if perhaps there are better ways to use that money for them.

CSR has a variety of projects in addition to their criminal justice work, including some focused on healthcare. Late last year their New Politics of Care project used an interactive map to highlight existing areas of health care needs. They proposed a New Deal for Public Health, with a million new community health workers deployed around the country based on the identified needs.

Somehow the Community Health Corps didn’t make it into the Biden infrastructure proposal. Perhaps no one in the Administration has seen the map.

Data visualization is nothing new for healthcare. The CDC has an Interactive Atlas of Heart Disease and Stroke, the Dartmouth Atlas has been highlighting healthcare variations for close to thirty years, and, more recently, the Johns Hopkins Coronarvirus Resource Center has been tracking what’s been happening in the pandemic.

Still, if anyone is tracking where healthcare’s “million dollar blocks” are, I’d like to hear about it.

We know — or think we know — that there are underserved communities where too many people end up in the emergency room. We know that there are communities in which maternal and infant mortality/morbidity are much worse.

But do we know where these are concentrated, or do we know how much we’re spending on the results of them? No.

I want to know in which communities the hospitals are the predominant healthcare institution. I want to know what communities are falling behind on preventive screenings and vaccinations. I want to know which communities have suspiciously low healthcare spending, and whether that is a function of better health or lack of healthcare resources.

I want to see the interactive data visualizations for these types of issues, and I want smart people acting on them.

If the pandemic has highlighted anything, it’s that our public health system is woefully inadequate. It doesn’t have the right resources and doesn’t have the right data, collected and acted upon at the right time.

Healthcare generates scads of data, but not the right data, timely, aggregated across all payors for all kinds of services, and we certainly don’t have anyone in a position to really use it to manage.

The “million dollar block” concept highlights the fact that we’re good at spending money, but we’re not very good about how we end up spending it. It emphasizes the rationale of “defund police” movement, and should be applied to healthcare as well (as I’ve discussed before).

I guess we need to see the pictures first.

This post is an abridged version of the original posting in Medium. Please follow Kim on Medium and on Twitter (@kimbbellard) 

Tuesday
Mar162021

Five Questions for John League with Advisory Board on the State of Telehealth Today and What’s Next? 

By Claire Thayer, March 16, 2021

Thanks to the pandemic, telehealth is here to stay! Advisory Board’s Senior Consultant, John League, joined us for a recent webinar on the state of telehealth today, offering insights for health payers in rethinking the digital experience to address downstream utilization, digital inequities, and more!  We caught up with John on five key takeaways:

1. Data is essential to advancing telehealth initiatives. What are the key data elements payers need to prioritize?

John League: All stakeholders need a better understanding of the downstream impact of upstream telehealth. Payers have tended to focus on data about utilization and per-service unit cost of telehealth—which are both important—but that doesn’t provide perspective on longer-term total cost of care or outcomes. We need data on things like how telehealth facilitates care coordination (are care coordination codes used more or less frequently via telehealth?), limits readmissions (including readmission and transfer from skilled-nursing facilities), and impacts other types of utilization (including labs, imaging, referrals, and prescriptions). 

2. What are some of the major challenges and barriers patients face in telehealth adoptions?

John League: Plans and providers can’t simply offer telehealth services; they have to recommend them as appropriate. I hear a lot of organizations worry that patients are increasingly choosing to do in-person visits over telehealth options. When I dig deeper, I often find that patients are getting no guidance on whether telehealth is a good option for their visit. Providers have the most influence here, but plans have a role, too. A recent Optum survey showed that half of patients who had actually used telehealth found out about it from their own doctor. Another 27% found out from their plan. 

Patients also need a quality virtual experience. It should have as many of the features of an in-person visit as possible. It should be at least as easy to schedule. It should provide a diagnosis, treatment plan, prescription, referral, or follow-up steps as appropriate. There should be clear steps for technical preparation and support. And they need to know how much it costs. Most cost-sharing is waived during the public health emergency, but a clear understanding of out-of-pocket costs is going to be essential in the future.

3. How can payers best understand, mitigate, and eliminate disparities and inequities in healthcare using telehealth?

John League: Addressing digital disparity begins with understanding the patients and communities in front of us: Does your organization understand how digital inequity presents in its members and patients? This also means diagnosing the nature of the inequity: Is it a challenge of connectivity, digital literacy, or trust in your organization and platform?

With that information, organizations can assess how their digital health priorities and investments mitigate digital inequities—or, unfortunately, maybe even deepen them. Only when each organization understands the nature of its members’ equity challenges and its own capacity to address them can it begin to partner with other organizations or advocate for policy change.

4. What do you see as the biggest challenge for payers in widespread telehealth adoption?

John League: The biggest challenge for payers is in helping patients and providers make the most valuable use of telehealth possible. I talk a lot about overall utilization rates—percentage of total visits done via telehealth—because that’s relatively easy to understand and quantify. It’s also a decent indicator of overall interest in telehealth. It’s also deceptive.

It's much more important to get the right visit types done virtually than it is to get any specific overall percentage of visits done virtually. There are some visit types that could almost all be virtual, and that’s where there’s big value for members. Are we getting prescription refills done virtually? What about pre- or post-op visits? What about behavioral health visits, or annual wellness checks?

Creating the right incentives and pathways so that patients trust telehealth for those purposes and providers are appropriately compensated for offering it is a significant but not insurmountable challenge.

5. What are your key takeaways in terms of where payers need to go and how to get there on their telehealth journey?

John League: First, don’t rely on pre-pandemic assumptions about telehealth. Telehealth was never deployed at scale before Covid-19. There is more data on its use than ever before. We need to dig into that hard-earned evidence and reassess how telehealth can help meet strategic objectives.

Second, focus on telehealth as a part of the overall care journey. It’s easy to focus on the unit cost of a telehealth visit, but that orientation ignores its potential to reduce total cost of care in other ways.

Finally, remember that telehealth has not reached a tipping point for the underserved. Many of the patients who could benefit most from telehealth aren’t able to access it. Work to develop an understanding of the ways that digital inequity affects your own members and how your organization’s priorities for digital investment will mitigate or deepen that inequity. 

If you missed this informative webinar presentation, Understanding Telehealth Today – and Preparing for its Next “New Normal”, we invite you to watch the full On-Demand webinar video, short webinar re-cap video, or reach John League directly at leaguej@advisory.com.

Wednesday
Sep092020

The Impact of Clinical AI: Four Questions for Jvion

By Claire Thayer, September 10, 2020


Recently, Jvion participated in a Healthcare Web Summit webinar discussion of how clinical AI differs from traditional predictive analytics and explored ways in which AI can improve patient risk trajectories while having positive impact on revenue, and identified key steps to implement adoption across organizations.  We caught up with Dr. John Showalter, Chief Product Officer, Jvion on four key takeaways from the webinar:


1. Why clinical AI? What’s the difference to other AI approaches?


Dr. John Showalter: Clinical AI focuses on an understanding of an individual patient and is designed to augment the actions and decisions of a care team. By understanding the individual drivers of risk and best actions to help a patient, an individual plan can be developed. Other AI approaches attempted to automate actions/processes, diagnose problems, or determine risk with a blackbox. The understanding of why and what to do is unique to Jvion.


2. What are the main gaps in traditional analytics like risk stratification and predictive modeling that leave healthcare organizations exposed?


Dr. John Showalter: The main gaps are predicting with non-modifiable risk factors, limited accuracy in risk predictions, population based protocols to respond to risk, and identifying too many individuals at risk. Current cohorting approaches frequently identify so many patients at risk that it is impossible to intervene on all of them effectively, especially when the individual gets an all or nothing population based protocol as an intervention.


3. What are a few of most pressing reasons for clinicians and healthcare organizations like payers to consider data augmentation in today's environment?


Dr. John Showalter: A few are: financial risk due to COVID-19, deferred care due to COVID-19, the aging population, increasing amounts of value-based contracts, increases in uncompensated care, increased consumerism, reducing health disparities.


4. What are the key things an organization should consider to ensure successful implementation and adoption of AI technology?


Dr. John Showalter: A commitment to adapting to the new insights, willingness to change workflows, identifying and tracking value attainment, identifying a need they are committed to fixing, full/broad stakeholder engagement.


If you missed this informative webinar presentation, Addressing the Iron Triangle of Healthcare With Clinical AI: Protecting Revenue While Improving Health Outcomes, we invite you to watch the On-Demand webinar video, short webinar re-cap video, or read the full Executive Brief.

Thursday
Aug272020

Thriving in COVID-19 Times

by Kim Bellard, August 27, 2020

These are, no question, hard times, due to the COVID-19 pandemic. Yes, these are hard times. But not for everyone.

No one should be surprised that Amazon is doing well, as more turn to online shopping and Amazon’s quick delivery, but The Wall Street Journal reports that Bog Box stores generally are doing well.

Similarly, if you’re a streaming service like Netflix or Disney+, the pandemic has been great for business. Video conferencing services like Zoom are booming. Car dealers are struggling, but not online car sales.

In healthcare, everyone seems to agree that the big winner has been telehealth. Industry leaders TelaDoc and Livongo merged, while rival Amwell got a $100 million investment from Google. No one is quite sure how much of the flexibilities introduced during the pandemic will persist once it recedes, but no one wants to miss out on what McKinsey predicts could be a $250b opportunity.

Of course, the pharmaceutical companies are doing fine in the pandemic. They’re the cockroaches of healthcare; they’re always going to survive. Some are even getting the federal government to directly pay for their vaccine research or therapeutics.

Health insurers are also proving to be big winners despite — or because of — the pandemic. Due to all those delayed/avoided treatments, they’re racking up huge profits so far in 2020.

The big loser is employer sponsored health insurance — or rather, the people who lost it. Kaiser Family Foundation estimates that 27 million people lost their health coverage due to losing their jobs in the pandemic.

Another big loser may be primary care practices, especially those not yet owned by health systems. Financial losses are predicted to be staggering, as patients stayed away in droves. As late as July, nearly 90% of primary care practices said they were still struggling due to COVID-19, according to a survey done for the Primary Care Collaborative.

Ann Greiner, president of PCC, said the report “is a clarion call to move to a new payment system that doesn’t rely on face-to-face visits and that is prospective so practices can better manage patient care.”

Hospitals also took a big hit, with the American Hospital Association predicting that losses would top $300b in 2020 due to the pandemic’s impacts. Some of these losses will be offset by the various federal bills (CARES and PPE), others by the rebound in the stock market, but some hospitals will continue to struggle — especially the already struggling rural hospitals.

During the pandemic, it has repeatedly struck me as a particular indictment of our healthcare system is that a health crisis causes so much disruption and so many financial losses. If a sick care system — which, let’s face it, is what we have — doesn’t do well when lots of people are sick, what are we doing?

In April of this year, Microsoft CEO Satya Nadella talked about the growth of its virtual platform Teams during the pandemic and declared, “In this era of remote everything, we have seen two years’ worth of digital transformation in two months.” Healthcare has also made some significant strides, but if all we take away from the pandemic is that maybe we should keep doing more telehealth, we’ll have missed the opportunity for real change.

The pandemic has important lessons for healthcare. We shouldn’t rely on employment for health insurance. We shouldn’t rely so heavily on elective procedures for health care revenues. We need to be more flexible about where and how people get their care.

This pandemic will eventually pass, in some form and with great damage. The healthcare system will survive, at least most of it. The challenge for us is to start making the changes needed for it to thrive even in the next crisis.

This post is an abridged version of the original posting in Medium. Please follow Kim on Medium and on Twitter (@kimbbellard)

Friday
Aug142020

“Buts” to Navigate in the Pandemic Acceleration of the Digital and Healthcare Experience Intersection 

By Clive Riddle, August 14, 2020

Accenture has just released a new 37-page report, the Accenture Digital Health Technology Vision 2020, based on a survey of 259 payer and provider healthcare executives, which found “that the vast majority (85%) of executives believe that technology has become an inextricable part of the human experience [and] furthermore, 45% of those polled said that rapid advancements in new technologies and scientific innovations are positioned to disrupt their industry.”

In a statement, Dr. Kaveh Safavi, a senior managing director in Accenture’s Health practice says that “COVID-19 has not slowed digital technology innovation; rather, it’s amplifying it to historic levels,” and surmised that “the intersection between digital technology and healthcare experiences has certainly accelerated with the COVID-19 pandemic, and leading the future of care will demand rethinking core assumptions about the intersection of people and technology. People’s perceptions of and relationships with technology are changing, and to adapt, healthcare payers and providers need to redesign digital experiences.”

The Accenture study found 78% of the healthcare provider and payer executives believe that the stakes for innovation have never been higher, but there are a number of “buts” in their findings that present obstacles to navigate in the middle of this digital and healthcare experience intersection, including:

  • 69% of healthcare payers and providers are already piloting or adopting artificial intelligence; BUT 39% said they have inclusive design or human-centric design principles in place to support human-machine collaboration.
  • 71% believe that robotics will enable the next generation of services in the physical world, BUT 54% believe that their employees will be challenged to figure out how to work with robots.
  • 70% of healthcare consumers polled as part of the research said they are concerned about data privacy and commercial tracking associated with their online activities, behaviors, location and interests, BUT that same number (70%) of consumers also said they expect their relationship with technology to be more prominent in their lives over the next three years.
Friday
Jul312020

Data Breaches – Unfortunately Healthcare Is the Leading Industry

By Clive Riddle, July 31, 2020

IBM Security has just released their 82-page 2020 Cost of a Data Breach Report, “a global study examining the financial impact of data breaches” finding that overall “these incidents cost companies studied $3.86 million per breach on average, and that compromised employee accounts were the most expensive root cause.”

Healthcare is unfortunately the leading industry in this arena. IBM tells us that “In the healthcare industry, the average cost of a data breach in 2020 was $7.13 million. Of the 17 industries surveyed, healthcare ranked first in average cost. The average time to identify and contain a breach in this industry was 329 days.”

The study was “based on in-depth interviews with more than 3,200 security professional in organizations that suffered a data breach over the past year….Based on in-depth analysis of data breaches experienced by over 500 organizations worldwide, 80% of these incidents resulted in the exposure of customers' personally identifiable information (PII). Out of all types of data exposed in these breaches, customer PII was also the costliest to businesses studied.”

The report states that “the average cost of a data breach has fluctuated between $3.50 million and $4.00 million in recent years.” For healthcare, it averaged $8.6 million in 2015 and reached $10.0 million in 2019, before reducing to $7.1 million this year.

Their overall conclusions include:

  • ·         Companies studied who had fully deployed security automation technologies (which leverage AI, analytics and automated orchestration to identify and respond to security events) experienced less than half the data breach costs compared to those who didn't have these tools deployed – $2.45 million vs. $6.03 million on average.
  • ·         In incidents where attackers accessed corporate networks through the use of stolen or compromised credentials, studied businesses saw nearly $1 million higher data breach costs compared to the global average – reaching $4.77 million per data breach. Exploiting third-party vulnerabilities was the second costliest root cause of malicious breaches ($4.5 million) for this group.  
  • ·         Breaches wherein over 50 million records were compromised saw costs jump to $392 million from $388 million the previous year. Breaches where 40 to 50 million records were exposed cost studied companies $364 million on average, a cost increase of $19 million compared to the 2019 report.
  • ·         The Most Damaging Breaches: Data breaches believed to originate from nation state attacks were the costliest, compared to other threat actors examined in the report. State-sponsored attacks averaged $4.43 million in data breach costs, surpassing both financially motivated cybercriminals and hacktivists.

The interactive version of the report provides an industry-specific calculator that shows the average cost of a data breach associated with various factors and the average amount organizations estimated these factors either increased or decreased the cost in the selected country or industry. This analysis looks at only one variable at a time and multiple cost factors cannot be combined.

We selected the healthcare industry, and ran the calculator for the following factors, yielding industry-specific results in order of dollar magnitude:

  1. Incident Response Testing - $275,136
  2. Business Continuity Plan- $273,585
  3. AI Platform - $232,452
  4. Employee Training - $245,920
  5. Extensive Encryptions - $195,376
  6. Formation of IR Team - $193,720
  7. Security Analytics -  $186,820
  8. Board Involvement - $181,526
  9. Red Team Testing - $176,730
  10. Cyber Insurance - $175,091
  11. Vulnerability Testing - $174,708
  12. DevSecOps - $174,671
  13. Threat Intel Sharing - $160,294
  14. Data Loss Prevention - $133,583
  15. CISO Appointed - $111,532
  16. ID Theft Protection - $48,693
  17. Managed Security System- $41,946

We should note that this Wednesday, August 5, 2020, at 2 PM Eastern, Alaap B. Shah, Member of the Firm, Epstein Becker Green will update health plans on cybersecurity trends and risk management response preparedness and best practices, in the complimentary HealthcareWebSummit event: Health Plan Cybersecurity Trends and Risk Management Response Preparations.

Friday
Jul172020

The Relationship (or lack thereof) Between a State’s Overall Health Ranking and Their COVID-19 Fatality Rate

by Clive Riddle, July 17, 2020

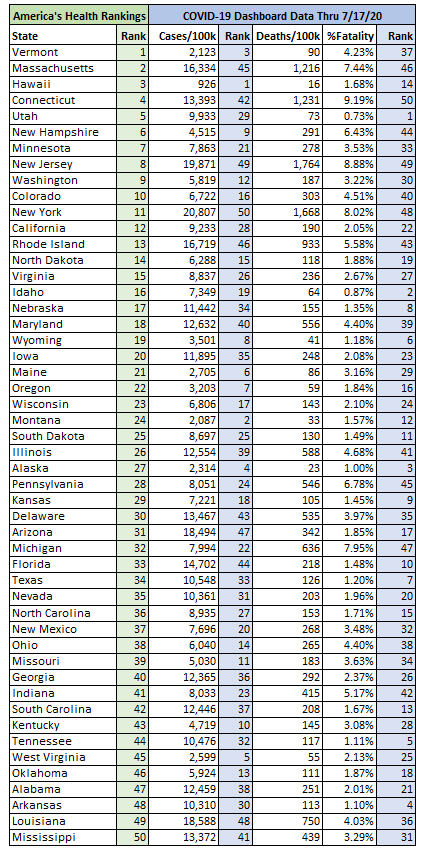
Given that co-morbidities have such an impact on COVID-19 fatalities, we thought it would be interesting to compare overall state health rankings that take co-morbidities into consideration, with COVID-19 fatality rates by state

We took the most recent results from America’s Health Rankings, their 30th annual report released in December, which provides a “comprehensive assessment of the nation’s health and on a state-by-state basis. The report includes 35 core measures of health that are used to rank states.” Would states with healthier lifestyles and lower incidence of co-morbidities translate into lower COVID-19 fatality rates? For that matter, would healthier lifestyles translate to lower case rates under the assumption those practicing healthier lifestyles might also practice more social distancing, mask-wearing and hand-washing?

We exported Johns Hopkins COVID-19 data through July 17th from the Kaiser Family Foundation State Health Facts webpage on Confirmed COVID-19 Cases and Deaths, and indicated rankings for COVID-19 fatality rates (Deaths per 1,000 / Cases per 1,000.) We also indicated the rank for Cases per 1,000 population.

The exercise unfortunately doesn’t indicate a widespread relationship. There are certain states whose rankings are similar (Utah and Hawaii in the Top 10 healthy states,) Actually, there appears to be a closer relationship in healthy state rankings and Cases/1,000 than with Fatality rates, although it is still not much of a relationship.

There are obviously more relevant factors at work here, than the overall state of a state populations’ health. But here is the state-by-state comparison of rankings:


Friday
Jul102020

The Relationship (or lack thereof) Between COVID-19 State Restrictions and Prevalence

By Clive Riddle, July 10, 2020

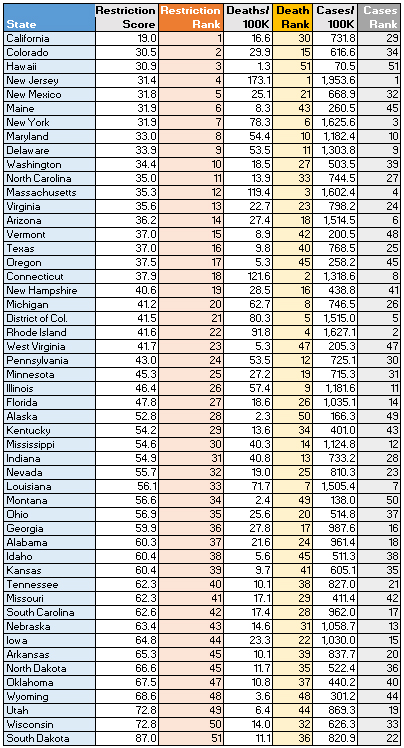
Wallet Hub earlier this week released updated rankings of States by Coronavirus Restrictions. The rankings were based on data available on July 6th, and assigned scores based on 18 metrics including “whether the state has any penalties for non-compliance with COVID-19 legislation to whether the state has required face masks in public and health checks at restaurants.”

They found the five least restrictive states – in order – to be South Dakota, Wisconsin, Utah, Wyoming and Oklahoma. They found the five most restrictive states – in order – to be California, Colorado, Hawaii, New Jersey, and New Mexico.

We thought it would be interesting to compare their rankings to COVD-19 prevalence, using current CDC deaths and cases per 100,000 population rates by state. The question to examine, if is there is a relative relationship between the levels of restrictions and COVID-19 deaths and cases per capita. The spreadsheet we compiled is provided below.

We reversed the rankings provided by WalletHub. They ranked states by the least restrictive – South Dakota was #1, California was #51. But in comparing Death and Case Rates where #1 would be the highest rates, we decided to rank states by the most restrictive – with the hypothesis that the most restrictive states should have the greatest prevalence.

The results were very mixed – you can select certain states to make whichever case you want. To go with the above hypothesis – you can point to Atlantic states like New Jersey, New York, Delaware and Maryland – all with a close relationship between their high levels of restrictions and high COVID-19 prevalence. You can also point to Wyoming on the other end of the scale that lines up #48 in restrictions, #48 in death rates and #44 in case rates.

On the other hand, there is Hawaii ranking third in most restrictions, but lowest in the nation in death and case rates, bolstering those who want to argue that imposing restrictions up front can result in lower prevalence (or an argument to move your state to an island.) MaIne also can make such a case – ranking 6th in restrictions but 43rd in deaths and 45th in cases (or perhaps a case to move your state further north than Toronto.) But on still another hand, California is less compelling, ranking first in restrictions but 30th in deaths and 29th in cases (California had a compelling case that deteriorated during the past month.)

And California’s deterioration of course highlights the problem that this exercise doesn’t address – the greater importance of recent change rates vs cumulative rates, and the impact of changes in restrictions. But for now, examining relationships between state approaches, and state incidence of COVID-19, is like everything else to do with the virus – quite a mess.

Thursday
Jun252020

TikTok Teens' Time

By Kim Bellard, June 25, 2020

I knew about TikTok, but not "TikTok Teens."  I was vaguely aware of K-Pop, but I didn't know its fans had common interests beyond, you know, K-Pop.  I'd been tracking Gen X and Millennials but hadn't really focused on Gen Z.  It turns out that these overlapping groups are quite socially aware and are starting to make their influence felt. 

I can't wait for them to pay more attention to health care. This generation has a lot to protest about, and a lot of ways to do it. They were in the news this past weekend due to, of all things, President Trump's Tulsa rally.  His campaign had boasted about having a million people sign up for the rally, only to find that the arena was less than a third filled.  An outdoor rally for the expected overflow crowd was cancelled. 

It didn't take long for the TikTok Teens/K-Pop fans to boast on social media about their covert -- to us older folks -- campaign to register for the rally as a way to gum up the campaign efforts.  Most doubt that these efforts had much to do with the low attendance -- it can be more likely attributed to concerns over COVID-19 and/or the concurrent Juneteenth celebrations/Black Lives Matter protests -- but they were responsible for cluttering up the Trump campaign's efforts to collect supporter/donor information from the registration.  As a subversive guerilla marketing campaign, it was brilliant -- and effective. 

It was not their first such involvement.  One of the surprises with the BLM protests have been the number young people in attendance, of all races.   Pew Research Center recently profiled Gen Z, finding them more ethnically and racially diverse, more education, more tech savvy, and, politically, "progressive and pro-government." 

Political strategist Tim Fullerton told The Washington Post: The bigger story, long-term, is that it’s really impressive to see young people using TikTok as an organizing tool. And I do think that we're going to see a lot of that in the lead-up to November. That's a difficult audience to reach, so it could be a powerful tool.  They’re using their voice in a new and different way and engaging people.  They clearly did something that hadn’t been done before.

All that is great, but it doesn't mean Gen Z is also leading the charge on healthcare, even during the pandemic.  They're no more likely to wear masks than other age groups, and are less likely to get vaccinated for it once one is available.   In many states experiencing a resurgence of COVID-19 cases, young people are increasingly being the ones infected

Dr. Thomas Tsai, a professor at Harvard's School of Public Health, warns: We need to change our whole thinking about COVID-19 during this stage of the pandemic.  It's difficult to contain the virus physically because you have younger individuals, who may be pre-symptomatic or mildly symptomatic, who are going about their normal lives and reengaging with society."

Epidemiologist Dr. Judith Malmgren told NPR that reaching Gen Z is different: "They are not reading print media. You need to be on social media. You need to use short sentences. You need to use very direct messaging."  Another epidemiologist, Dr. Wafaa El-Sadr, added: "I think young people can potentially have a very, very valuable role if we can harness their energy and attention."

If.

This is the generation that is going to inherit our apathy towards climate change and huge budget deficits.  It shouldn't have to inherit our dysfunctional healthcare system as well.  If they are looking for big, important social challenges, well, Defund Health Care!

This post is an abridged version of the original posting in Medium. Please follow Kim on Medium and on Twitter (@kimbbellard) 

Friday
Jun052020

Long Term Care COVID-19 Deaths – Six Things To Know from CMS Data

By Clive Riddle, June 5, 2020

Diving into the new CMS COVID-19 Dataset on Medicare and Medicaid Long Term Care Facilities, here are six things to know from the data reported through May 31st, 2020:

1. 0.4% of the reporting facilities - the top 50 facilities by cumulative COVID-19 deaths – represent  22.6% of the COVID-19 deaths reported.

2. The top 1% of the reporting facilities– represent 35.5% of the COVID-19 deaths reported.

3. Cumulative COVID-19 Deaths reported in the dataset represent 40.4% of total deaths at those facilities. However, there may be issues with the total deaths reported in the dataset, as the COVID-19 deaths exceeded the total deaths reported in 12 of the top 50 facilities by COVID-19 alone.

4. Here is a listing of the top 20 facilities by cumulative COVID-19 deaths:

  • ·         Dellridge Health & Rehabilitation Center, Paramus, NJ (753)
  • ·         Family Of Caring Healthcare At Ridgewood, Ridgewood, NJ (517)
  • ·         Advanced Subacute Rehabilitation Center At Sewell, Sewell, NJ (396)
  • ·         Southern Pointe Living Center, Colbert, OK (339)
  • ·         Complete Care At Summit Ridge, West Orange, NJ (311)
  • ·         Blaire House Of Tewksbury, Tewksbury, MA (282)
  • ·         Pleasant View Nsg Home, Mount Airy, MD (253)
  • ·         Durand Senior Care And Rehab Center, L L C, Durand, MI (243)
  • ·         Martha T Berry Mcf, Mount Clemens, MI (214)
  • ·         Advantage Living Center - Samaritan, Detroit, MI (163)
  • ·         Avanti Wellness & Rehab, Niles, IL (158)
  • ·         Parkhouse Rehabilitation And Nursing Center, Royersford, PA (149)
  • ·         Orchard View Manor, East Providence, RI (133)
  • ·         Sunset Home, Quincy, IL (123)
  • ·         Bickford Health Care Center, Windsor Locks, CT (123)
  • ·         Neshaminy Manor Home, Warrington, PA (119)
  • ·         Park Ridge Nursing Home, Rochester, NY (119)
  • ·         Crystal Rehabilitation And Healthcare Center, Greenwood, MS (118)
  • ·         Saint Mary'S Villa Nursing Hom, Moscow, PA (114)
  • ·         Knolls West Post Acute Llc, Victorville, CA (106)
  • ·         Sunset Lake Health And Rehabilitation Center, Venice, FL (103)

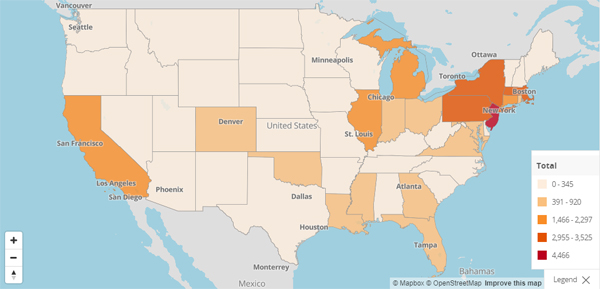
5. CMS provides this map of COVID-19 Deaths by State:

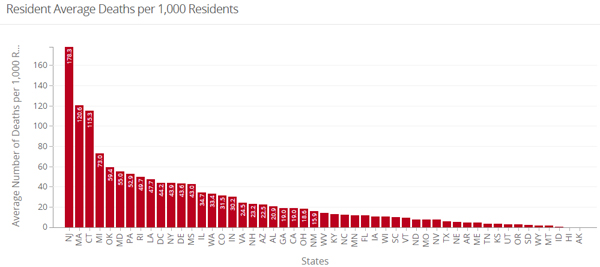
6. CMS also provides this chart of Deaths per 1,000 Residents by State, with New Jersey at 178.3, followed by Massachusetts at 120.6 and Connecticut at 115.3. The national average is 30.2:

Friday
Apr032020

Deploying SDoH Factors in the COVID Battle

By Clive Riddle, April 3, 2020

PWC’s Health Research Institute recent released: COVID-19: Six things health organizations should be considering (but might not be) offering six strategies that could be deployed in the fight against the pandemic. Number five on that list was SDoH:

“Strategies on social determinants of health can be an advantage in pandemic response. Trust-based relationships are important when people and communities are scared and unsure of what to do. Coalitions developed for pandemic response, much like social determinants of health interventions, should include trusted community organizations and providers that have access to hard-to-serve or underserved communities that may not be able to get information and support from traditional sources such as their employer or local government.”

A companion graphic noted "Less than 50% of primary care physicians said their practices coordinate with the right social service agencies.”

Health plans have come to embrace the SDoH component of removing economic barriers in treatment of COVID-19. While initially announcing waiver of any out-of-pocket costs for testing, more recently many health plans have issued announcements of waiving all treatment costs to consumers, including Aetna’s announcement on March 25th,   Humana’s announcement and Cigna’s announcement on March 30th, followed by UnitedHealthcare on March 31st and Anthem on April 1st.

Also, numerous health plans are making sizeable donations to COVID-19 relief efforts in their markets, including these:

Harvard Pilgrim Health Care Foundation Gives More Than $3 Million for Covid-19 Relief Efforts

Medica Donates $1 Million to Minnesota Non-Profits to Meet Emergency Needs from the Coronavirus

21 Organizations to Receive First $500K of $1M Committed by the Tufts Health Plan Foundation

Health Net Rolls Out $5.9 Million in COVID-19 Assistance for Those Serving Medi-Cal Members

But a more proactive approach in leveraging SDoH in the COVID-19 battle is being offered by analytics technology companies. Two such approaches were profiled in the April Care Technology Edition of Care Analytics News, discussing Jvion’s new COVID Community Vulnerability Map and Clarify’s COVID-19 Elderly Vulnerability Population Index (EVI) and the Clarify COVID-19 Patient Risk Profile

Jvion’s  COVID Community Vulnerability Map is built on Microsoft Azure maps, and enables healthcare providers and communities to identify the social determinants of health (SDoH) that put populations at greater risk during the COVID pandemic. Jvion states the map’s purpose is to inform “community planning and resource allocation to proactively mitigate the risk to vulnerable populations.” The Jvion COVID Community Vulnerability Map is available at https://covid19.jvion.com,


The interactive map identifies populations down to the census block level that are at risk for severe outcomes upon contracting a virus like COVID. Severe outcomes include hospitalization, organ failure and mortality. Additionally, the map surfaces the socioeconomic and environmental factors, such as lack of access to transportation or nutritious food, that put patients at greater risk. The map is also overlaid with points of interest, such as hospitals, food sources and transportation, in relation to the at-risk communities. These insights can help inform providers, public health organizations and community support agencies as they look to deploy interventions, outreach and other services to keep individuals from contracting the virus and, once infected, manage their care towards a positive outcome.

The map can quickly help local health departments prioritize their limited resources for response planning and adapt their tactics to the needs of neighborhoods and communities. By understanding the differentiated needs within their population, health systems can more adequately plan for healthcare utilization, deploy preventive or mitigating care resources, and anticipate the short-, mid- and long-term impacts of public health decisions, such as school and business closures.

Clarify Health announced that it launched two new critical applications in response to the needs of customers at the forefront of providing care to the communities impacted by COVID-19. The company is deploying the Clarify COVID-19 Elderly Vulnerability Population Index (EVI) and the Clarify COVID-19 Patient Risk Profile to healthcare organizations across the US to equip them with the patient risk insights that are needed to inform resource planning, interventions, and community initiatives.

The two applications leverage Clarify’s patient dataset, covering over 300 million lives, and AI capabilities. The solutions will reduce blind spots in patient risk by giving healthcare organizations access to an actionable COVID-19 vulnerability score for their elderly patients and a drill-down view into individual risk profiles and comorbidities at the point of care. Clarify’s COVID-19 EVI measures ZIP codes on relative vulnerability of seniors to severe coronavirus infection and delivers insights into their comorbidities, such as, cardiac diseases, respiratory diseases (including COPD), and cancer. The EVI provides hospitals, emergency services, health plans, and government agencies with the ability to identify neighborhoods which could benefit from greater testing or support services and prepare to take action quickly in high risk areas.

Clarify’s COVID-19 Patient Risk Profile is a web-based interface that highlights known risk factors for severe illness related to COVID-19. This capability is critical as frontline care providers struggle to proactively manage capacity and care for COVID-19 suspicious patients.


Thursday
Mar262020

The New Scarlet Letter

By Kim Bellard, March 26, 2020

If you live in one of the jurisdictions that have imposed stay-at-home requirements, you’re probably making your essential excursions — grocery store, pharmacy, even walks — with a wary eye towards anyone you come across. Do they have COVID-19? Have they been in contact with anyone who has? Are they keeping at least the recommended six feet away from you? In short, who is putting you at risk?

Well, of course, this being the 21st century, we’re turning to our smartphones to help us try to answer these questions. What this may lead to remains to be seen.

Last week Israel granted its domestic security agency emergency powers to track the mobile phone data of people who have (or may have) coronavirus. The intent is for the health ministry to track whether such persons are adhering to quarantine rules, and possibly to alert others who had previously come in contact with them.

China is using the AliPay Health Code to assign color codes to individuals based on their known health status — green, yellow, red. The system is used in real time to determine, for example, who can board mass transit or use public housing. It is being rolled out nationwide, despite the lack of transparency about how the codes are determined, used, or updated.

Singapore has developed a tool — TraceTogether — that uses Bluetooth to track whose phones have been in close contact, and for how long. If someone then tests positive for COVID-19, the health ministry can easily determine who has been in contact with them.

South Korea is using smartphone data to create a publicly available map of movements of known coronavirus patients, and aggressively message those who might have come in contact with them.

Unfortunately, the information about their movements is having significant ripple effects, disclosing destinations users might have preferred not be public, or attaching a stigma to places they frequented.

In the U.S., volunteers from several big tech companies built covidnearyou, which allows people to self-report such facts as any symptoms, travel history, or exposure to people who have tested positive. Anyone can then use their map to determine if there are affected individuals near them.

MIT’s Media Lab has developed Private Kit: Safe Paths, “An app that tracks where you have been and who you have crossed paths with — and then shares this personal data with other users in a privacy-preserving way.” Unlike efforts in some other countries, the data is encrypted and does not go through a central authority. MIT Technology Review says:

Going one step further, two San Francisco hospitals have developed a smart ring that is “able to detect body temperature and pulse.” It is aimed at health care professionals and workers, such as ER doctors, as an early indicator of COVID-19 exposure. It’s probably only a matter of time before laypersons demand a version.

One can easily imagine such a smart ring being connected to a smartphone app, perhaps even generating a color code, and broadcasting the individual’s status and location to others worried about potential exposure. I bet Alibaba would be happy to help.

Tagging people and then broadcasting that tag, along with location and even identity, could put people at risk of discrimination (e.g., refused service or contact) and even attacks.

And we need to bear in mind that whatever technology we bring to bear on this public health problem could subsequently be used for other problems, public health or other. We increasingly live in a surveillance society, and that can be to our benefit — or to our detriment. We don’t always realize the slippery slope we’re on until the slide has become irreversible.

I’m all for using technology to address public health crises. I’m just not clear what the ultimate price we’re going to have to pay for that, and that makes me nervous.

This post is an abridged version of the original posting in Medium. Please follow Kim on Medium and on Twitter (@kimbbellard)

Friday
Mar062020

Will COVID-19 Create a Tipping Point For TeleHealth and Mobile Apps?

by Clive Riddle, March 6, 2020

mHealthIntelligence reminds us that the emergency spending now passed by Congress "will waive Medicare’s geographical restrictions on telehealth during a public health emergency, enabling providers to use telehealth in urban and rural areas as well as in the patient’s home" and "also loosens restrictions on the use of a telephone to deliver care, as long as that phone has audio-visual capabilities."

The Wall Street Journal notes that "doctor groups, hospitals and health insurers are increasingly steering people with mild or no symptoms toward initial visits conducted by phone, interactive video or secure messaging. They are also starting to use the technology to care remotely for people with suspected or confirmed cases of Covid-19, the respiratory disease caused by the virus."

CNBC reports, from a market perspective, that “Coronavirus could be a boon for telemedicine, as health industry hopes to keep ‘worried well’ out of the hospital” and that “the coronvirus outbreak could provide a bright spot for one sector of the health industry that has struggled to gain widespread acceptance: Telemedicine. Health insurer Anthem, for instance, is staffing up more doctors for its  service, LiveHealth Online, in case there are more cases in the United States. Telemedicine start-ups are also bracing for a rush of customers.”

But StatNews tell us that "Telehealth can help fight the novel coronavirus, but U.S. challenges could limit its potential," noting that "there are obstacles to telehealth in the U.S., since its health care system is not well-suited to widely adopt digital health tools. The biggest challenges stem from factors that don’t exist in China, like our vast array of private, state, and federal payers with varying reimbursement policies and state-based medical licensing."

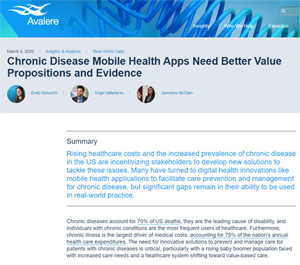
These U.S. obstacles also impact adoption rates for mobile apps – which are evident not just with the urgent issue of COVID-19, but with the increased prevalence of chronic disease. Avalere has just released a report “Chronic Disease Mobile Health Apps Need Better Value Propositions and Evidence” that tells us this “increased prevalence of chronic disease in the US are incentivizing stakeholders to develop new solutions to tackle these issues. Many have turned to digital health innovations like mobile health applications to facilitate care prevention and management for chronic disease, but significant gaps remain in their ability to be used in real-world practice.”

The crux of the problem? Avelere says “mobile health apps are difficult to sell directly to patients, introducing additional complexity for how to fund the provision and maintenance of these technologies. With relatively few patients willing to pay for digital tools, health care organizations – providers (health systems or primary care practices) and payers (self-insured employers or health insurers) – often assume the costs. To date, little evidence demonstrates improved health outcomes or lowered costs that can justify the cost of development and adoption. However, some promising examples demonstrate clinical efficacy and cost savings in digital chronic disease management solutions”

Avalere advises that “to drive broader use and adoption of digital solutions in chronic disease, app developers need a strong value proposition that can demonstrate improved outcomes and cost efficiency to organizations that can both pay for apps and incentivize providers and physicians to use them.”

Perhaps COVID-19 might be an impetus with value proposition that could stimulate greater overall adoption that would benefit chronic disease initiatives as well.

Friday
Jan242020

The Yellow Brick Road to Savings $13B In Further Automated Healthcare Administrative Transactions

By Clive Riddle, January 24, 2020

CAQH has released their seventh annual report  - the 2019 CAQH Index - which measures "the progress made by the healthcare industry in reducing the costs and burden associated with administrative transactions through automation. Their 49-page report found that "of the $350 billion dollars widely cited as the cost of administrative complexity in the US healthcare system, $40.6 billion is spent on eight administrative transactions. Of that, the industry can save $13.3 billion, or 33 percent of existing annual spend, by transitioning to fully electronic processes." 

Regarding the $13.3 billion in potential savings through automation, the report tells us “$9.9 billion can be saved by the medical plans and providers, while $3.4 billion can be saved by the dental industry. In both industries, the greatest savings exist for providers as compared to plans.”

The Index report “analyzes levels of automation, spending and savings opportunities for eight administrative transactions related to verifying patient insurance coverage and cost sharing, obtaining authorization for care, submitting claims and supplemental information and sending and receiving payments.”

What are these eight transaction categories, and what were their corresponding rates of full electronic transaction processing in 2019 vs. 2015?

  1. Eligibility and Benefit Verification:  84% 2019 | 71% 2015
  2. Prior Authorization  13% 2019 | 10% 2015
  3. Claim Submission  96% 2019 | 94% 2015
  4. Attachments  20% 2019 | NA 2015
  5. Coordination of Benefits  86% 2019 | 49% 2015
  6. Claim Status Inquiry  70% 2019 | 57% 2015
  7. Claim Payment  70% 2019 | 61% 2015
  8. Remittance Advice  50% 2019 | 51% 2015

Of these eight transaction categories  - the term “Attachments” might be a little generic and require further definition. CAQH defines Attachments as "the exchange of patient-specific medical information or supplemental documentation needed to support administrative transactions and clinical decisions." They go on to say "serving as a bridge between clinical and administrative data, attachments are also critical to the success of value-based payment models" and that the majority of attachments are exchanges through mail and fax as opposed to electronically.

The largest remaining estimated savings opportunities from further automation are with:

  • Eligibility and Benefit Verification:  $4.24 Billion
  • Claim Status Inquiry: $2.16 Billion
  • Remittance Advice: $1.85 Billion

CAQH’s call to action for the industry to achieve these savings centers around:

  • Focusing efforts to reduce provider burden
  • Accelerating standards and operating rule development to support harmonization of administrative and clinical data exchange
  • Needing vendor adoption of all standards and operating rules; and
  • Expanding research related to the administrative workflow
Friday
Nov012019

Measuring Telehealth Satisfaction: J.D. Power Study Finds Early Adopters Love It

by Clive Riddle, November 1, 2019

Telehealth use has progressed to the point where J.D. Power now has added the category to items included in their consumer satisfaction studies. The J.D. Power 2019 Telehealth Satisfaction Study finds that while “nationwide consumer adoption of telehealth services has been stubbornly low, with just 10% of healthcare consumers having used such services,” among those early adopters who are using telehealth, customer satisfaction with the experience ranks among the highest of any consumer category studied by J.D. Power.”

Greg Truex, Managing Director, Health Intelligence at J.D. Power offers this perspective: “Early attempts at trying to convince consumers to bank via their phone failed, and initiatives were abruptly canceled. Now, with mobile banking apps having grown to become the third-most-used application among consumers, we expect telehealth to follow a similar path. Telehealth offers an alternative avenue to receive quality care that is cost efficient and accessible. Once providers and payers refine the formula for awareness and adoption, telehealth will change the landscape of how affordable and quality care is delivered.”

J.D. Power found “the overall customer satisfaction score for telehealth services is 851 (on a 1,000-point scale), and is 900 or higher among 46% of telehealth users.,” and that “these customer satisfaction scores are among the highest of all healthcare, insurance and financial services industry studies conducted by J.D. Power. Only direct banking customer satisfaction ranks higher, with an average score of 855.”

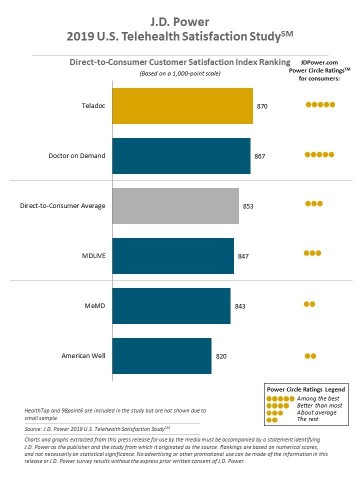
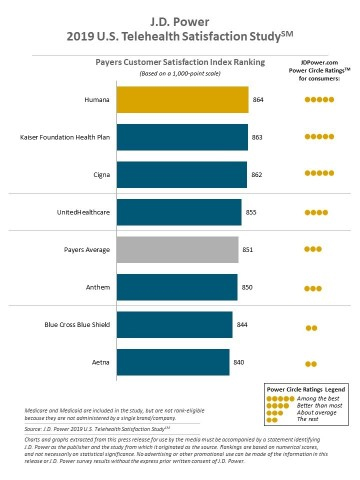
Among direct-to-consumer brands, Teladoc ranked highest with a score of 870. Followed by Doctor on Demand (867) and MDLIVE (847). Among payers of health plan-provided telehealth services, Humana ranks highest with a score of 864, followed by Kaiser (863) and Cigna (862).


Additional J.D. Power study findings included:


  • 65% of telehealth users used the service because they received a positive recommendation from others, including friend, family or colleague (22%); health plan (21%); primary care doctor (20%); employer (18%); or health plan, hospital, or another provider (15%).
  • Among consumers who have not used telehealth, 29% indicate that telehealth is not available to them and 37% say they do not know if it is offered by their health provider or health system.
  • Self-reported availability is lowest in rural areas (25%).
  • 84% of telehealth users were able to completely resolve their medical concern(s) during their visit 
  • 73% of users did not experience any issues or problems during their service.
  • 49% of users say there were no barriers that made using telehealth difficult.
  • 87% of users describe the enrollment process as somewhat/very easy.
  • Users averaged 44 minutes for their entire experience, including: 17 minutes to complete the enrollment process, 9 minutes to wait for a physician or nurse practitioner and 18 minutes for the actual consultation. 


Friday
Jul192019

Overconfident Healthcare Organizations? Could Be According to Healthcare Cybersecurity Survey 

By Clive Riddle, July 19, 2019

LexisNexis Risk Solutions in collaboration with Information Security Media Group has released results from their recent survey of hospitals, medical groups and payers, in their new 18-page report The State of Patient Identity Management, which found 50% are confident they have the necessary controls in place to prevent unauthorized access to patient information, 58% believe their portal cybersecurity is above average (and only 6% feel they are below average), yet 35% don’t deploy multifactor authentication.

To digress, some insight into those results can be gained from reading last week’s mcolblog post by Kim Bellard on Our Dinning-Kruger Healthcare System, which discusses the Dunning Kruger effect involving “the cognitive bias that leads people to overestimate their knowledge or expertise,” illustrated in the world of NPR’s Lake Wobegon – where “all the children are above average.” 

88% of the organizations surveyed had patient/member portals, and 93% use username and password as the patient portal authentication method. 65% deploy multifactor authentication, with 39% using a knowledge-based Q&A for verification, 38% using email verification, and 13% deploy device identification. 65% report that their individual state budgets for patient identity management will not increase in 2019.

Here’s the top three cybersecurity takeaways of the report according to LexisNexis:

  1. Traditional authentication methods are insufficient: As a result of many healthcare data breaches, hackers have access to legitimate credentials; users are also easily phished. Therefore, traditional username and password verification are considered an entry point, not a barrier, and alone cannot be relied upon to provide a confident level of security.
  2. Multifactor authentication should be considered a baseline best practice: HCOs should rely on a variety of controls, ranging from knowledge-based questions and verified one-time passwords to device analytics and biometrics to authenticate users based on the riskiness of the transaction. The more risky the access request is, the more stringent the authentication technique should be.
  3. The balance between optimizing the user experience and protecting the data must be achieved in an effective cybersecurity strategy: HCOs need to make it easy for patients and partners to access records while ensuring adequate data protection. To do this, an HCO's cybersecurity strategy should layer low to no-friction identity checks up front, making it easier for the right users to get through and layer more friction-producing identity checks on the back end that only users noted as suspicious would complete.