Search
Thursday
Sep292016

What Health Plans Should Know About Marketing Costs

By Claire Thayer, September 29, 2016

Getting your message in front of the right audience sounds easy enough, but can be quite complicated for health plans during open enrollment season as well as throughout the year for member outreach.  A recent study of administrative expenses for Blue Cross Blue Shield finds that the 26.5% of total PMPM expenses is attributed directly to sales and marketing activities.  Being judicious and figuring out best practices for member engagement, when to contact members, identifying the healthcare CEO of the household, what language members speak at home, etc. requires marketing tools with intelligence capabilities to optimize campaign initiatives.

Helping health plans to keep their marketing costs down is the focus of a recent MCOL infographoid, co-sponsored by LexisNexis Health Care, highlighted below:

MCOL’s weekly infoGraphoid is a benefit for MCOL Basic members and released each Wednesday as part of the MCOL Daily Factoid e-newsletter distribution service – find out more here.

Thursday
Sep222016

I Really Wish You Wouldn't Do That

By Kim Bellard, September 22, 2016

Digital rectal exams (DREs) typify much of what's wrong with our health care system.  Men dread going to go get them, and -- oh, by the way – they apparently don't actually provide much value. By the same token, routine pelvic exams for healthy women also don't have any proven value either.

The recent conclusions about DREs come from a new study.  One of the researchers, Dr. Ryan Terlecki, declared: "The evidence suggests that in most cases, it is time to abandon the digital rectal exam (DRE).  Our findings will likely be welcomed by patients and doctors alike."

The study actually questioned doing DREs when PSA tests were available, but it's not as if PSA tests themselves have unquestioned value.  Even the American Urological Association came out a few years ago against routine PSA tests, citing the number of false positives and resulting unnecessary treatments.

Indeed, the value of even treating the cancer that DREs and PSAs are trying to detect -- prostate cancer -- has come under new scrutiny.  A new study tracked prostate cancer patients for ten years, and found "no significant difference" in mortality between those getting surgery, radiation, or simple active monitoring.

The surgery and radiation, on the other hand, had some unwelcome side effects.  Forty-six percent of men who had their prostate removed were wearing adult diapers six months later, and impotence was reported in 88% of surgical patients and 78% of radiation patients.

As for the pelvic exam, about three-fourths of preventive visits to OB-GYNs include them, over 60 million visits annually.  They're not very good at either identifying or ruling out ovarian cancer, and the asymptomatic conditions they can detect don't have much data to indicate that treating them early offers any advantage to simply waiting for symptoms.

Or take mammograms.  Mammograms are uncomfortable, have significant false positive/over-diagnosis rates, and costs us something like $4b annually in unnecessary costs, yet remain the "gold standard."

Then there is everyone's favorite test -- colonoscopies.  Only about two-thirds of us are getting them as often as recommended, and over a quarter of us have never had one.  There are other alternatives, including a "virtual" colonoscopy and now even a pill version of it, but neither has done much to displace the traditional colonoscopy.  And all of those options still require what many regard as the worst part of the procedure, the prep cleansing.

The final example is what researchers recently called an "epidemic" of thyroid cancer, which they attributed to overdiagnosis. In fact, according to the researchers: "The majority of the overdiagnosed thyroid cancer cases undergo total thyroidectomy and frequently other harmful treatments, without proven benefits in terms of improved survival."  Not only that, once they've had the surgery, most patients will have to take thyroid hormones the rest of their lives.

All of these examples happen to relate to cancer, although there certainly are similar examples with other diseases/conditions (e.g., appendectomy versus antibiotics for uncomplicated appendicitis).

Two conclusions:

1.  If we're going to have unpleasant things done to us, they better be based on facts

2.  We should do everything we can to make unpleasant things, well, less unpleasant:

Let's get right on those.


This post is an abridged version of the posting in Kim Bellard’s blogsite. Click here to read the full posting


Thursday
Sep152016

Workplace family monthly health premiums rise to $1,512; deductibles up 12% in 2016

By Claire Thayer, September 15, 2016

In 2016, employer-sponsored health insurance covered half of the non-elderly population.  For the 18th year in a row,  the Kaiser Family Foundation & Health Research & Educational Trust (HRET) published findings from its annual survey of employers reflecting trends of employer sponsored health benefits on premiums, employee cost-sharing, wellness programs and employer opinions in the 2016 Employer Health Benefits Survey.  Here are a few highlights:

  • The average premium for single coverage in 2016 is $536 per month, or $6,435 per year.
  • The average premium for family coverage is $1,512 per month or $18,142 per year
  • The $18,142 average family premium in 2016 is 20% higher than the average family premium in 2011 and 58% higher than the average family premium in 2006
  • Among those with a general annual deductible for family coverage, the percentages of covered workers with an average aggregate general annual deductible are 61% for workers in HMOs, 64% for workers in PPOs, and 77% for workers in POS plans
  • The share of covered workers in plans with a general annual deductible has increased significantly over time: from 55% in 2006, to 74% in 2011, to 83% in 2016, as have the average deductible amounts for covered workers in plans with deductibles: from $584 in 2006, to $991 in 2011, to $1,478 in 2016
  • Eighty-three percent of firms offering health benefits in 2016 offer only one type of health plan. Large firms are more likely to offer more than one plan type than small firms (53% vs. 16%)
  • Enrollment remains highest in PPO plans, covering just under half of covered workers, followed by HDHP/SOs, HMO plans, POS plans, and conventional plans.
  • Forty-eight percent of covered workers are enrolled in PPOs, followed by HDHP/SOs (29%), HMOs (15%), POS plans (9%), and conventional plans (< 1%)
  • Nearly all (more than 99%) covered workers work at a firm that provides prescription drug coverage in their largest health plan.
  • Sixty-one percent of covered workers are in a self-funded health plan.
  • Twenty-four percent of large firms (200 or more workers) that offer health benefits to their employees offer retiree coverage in 2016, similar to recent years.
  • Among large firms that have a health risk assessment, 54% offer an incentive to employees to complete the assessment

Says KFF President and CEO Drew Altman, “We’re seeing premiums rising at historically slow rates, which helps workers and employers alike, but it’s made possible in part by the more rapid rise in the deductibles workers must pay.”


More info:

  • Summary of findings is here
  • Entire report with over 200 exhibits in 14 different sections is here
  • News release is here
  • Health Affairs article is here


Friday
Sep092016

Uber, Lyft and Healthcare

By Clive Riddle, September 9, 2016

Bruce Japson, in his Forbes article earlier this summer - On-Demand Health's Growth Second Only To Uber And Lyft, that "investment in on-demand health services is projected to reach $1 billion in 2017 with Teladoc and rival telehealth firm American Well joining the likes of Uber and Lyft in the top 10 most funded on-demand companies, according to the most recent tally by consulting giant Accenture ACN -1.02%. Investment in on-demand health was just $200 million in 2014."

While Bruce was talking about valuations of on demand companies, it is most interesting that on a different level, the paths of healthcare and on demand ride services are converging.

Just this week, CareMore Health System touted their recent collaboration with Lyft that “Improves Access to Care, Reduces Transportation Cost and Wait Times” according to results from a pilot study of their Medicare Advantage beneficiaries that was just published in the Journal of the American Medical Association (JAMA),  in the article, “Nonemergency Medical Transportation: Delivering Care in the Era of Lyft and Uber

CareMore notes that “individuals using the service are now waiting an average of just nine minutes to be taken to or from their medical appointment” and that “average per-ride costs have been reduced by more than 30 percent (from $31.54 to $21.32). Satisfaction with the new program, which covers beneficiaries in selected areas of southern California, exceeded 80 percent.” CareMore plans to continue the program and potentially expand to markets beyond California.

Earlier this year, MedStar Health, the largest not-for-profit healthcare system in Maryland and the Washington, D.C., region, and Uber announced a collaboration “to give patients a new option for ensuring they can get to and from healthcare appointments. Patients who miss appointments or have to reschedule at the last minute frequently cite transportation as a factor.”

The Advisory Board, writing about in July, in their article “A surging trend: Uber, Lyft have hospitals rethinking patient access” reported that “other hospitals quickly became interested in MedStar's model, said Michael Ruiz, chief digital officer for MedStar. ‘We probably had 50 different systems across the country reach out to us and ask us 'How did you do it?’’ Several other hospitals have formed partnerships with Uber this year, including New Jersey-based Hackensack UMC and Florida-based Sarasota Memorial Hospital.”

How many years off are we from driverless Uber and Lyft cars picking us up for our healthcare visits?

Tuesday
Aug302016

High Drug Prices, Complexity of Drug Development and What the Market Will Bear

By Claire Thayer, August 30, 2016

The escalating cost of prescription drugs is of concern for all of us and impact stakeholders all across the health continuum: patients, payers, providers, as well as policy makers.   A recent Consumer Reports study, Is There a Cure for High Drug Prices?, offers these 5 reasons drug costs are ballooning:

  • Reason #1: Drug Companies Can Charge Whatever Price They Want
  • Reason #2: Insurance Companies Are Also Charging You More
  • Reason #3: Old Drugs Are Reformulated as Costly ‘New’ Drugs
  • Reason #4: Generic Drug Shortages Can Trigger Massive Price Increases
  • Reason #5: Specialty Drugs Are Costing All of Us

This week, the Journal of the American Medical Association (JAMA) released an in-depth article, The High Cost of Prescription Drugs in the United States, which explores literature from January 2005 to July 2016 for sources of drug prices in the U.S., justification and consequences of high prices and possible solutions.  The authors conclude that “high drug prices are the result of the increasing cost and complexity of drug development but also arise in large part from the approach the United States has taken to the granting of government-protected monopolies to drug manufacturers, combined with restriction of price negotiation at a level not observed in other industrialized nations.”

Among overall study findings:

  • In 2013, per capita spending on prescription drugs was $858 compared with an average of $400 for 19 other industrialized nations.
  • In the United States, prescription medications now comprise an estimated 17% of overall personal health care services.
  • The most important factor that allows manufacturers to set high drug prices is market exclusivity, protected by monopoly rights awarded upon Food and Drug Administration approval and by patents.
  • The availability of generic drugs after this exclusivity period is the main means of reducing prices in the United States, but access to them may be delayed by numerous business and legal strategies.
  • The primary counterweight against excessive pricing during market exclusivity is the negotiating power of the payer, which is currently constrained by several factors, including the requirement that most government drug payment plans cover nearly all products.
  • Another key contributor to drug spending is physician prescribing choices when comparable alternatives are available at different costs.
  • Although prices are often justified by the high cost of drug development, there is no evidence of an association between research and development costs and prices; rather, prescription drugs are priced in the United States primarily on the basis of what the market will bear.
Friday
Aug262016

EpiPens By The Numbers

by Clive Riddle, August 26, 2016

Without wading into the policy, prognostication, editorial or other narrative issues surrounding Mylan’s EpiPen pricing controversy, here simply is a collection of selected relevant data compiled related to all that is Mylan EpiPen:

Tuesday
Aug162016

Out With the Old...Wait, Not in Health Care

By Kim Bellard, August 16, 2016

The last company still manufacturing VCRs announced it has ceased their production.  VCRs had a good run, most households had one, but their time has passed.  Meanwhile, the stethoscope is celebrating its 200th birthday, and is still virtually the universal symbol for health care professionals.  

There has got to be a moral in there somewhere. VCRs are a classic example of how technology (usually) moves on.  Except in health care.

Like stethoscopes.  Digital advocate Dr. Eric Topol recently tweeted: "The stethoscope's 200th birthday should be its funeral. That's all well and good, but -- to paraphrase Mark Twain -- reports of its death are greatly exaggerated.

It's not like stethoscopes do all that good a job, or, perhaps, that physicians use them all that well.  A 2014 study found that participants only detected all tested sounds 69% of the time.  As the authors diplomatically concluded, "a clear opportunity for improving basic auscultations skills in our health care professionals continues to exist."   

Oh, and stethoscopes also help carry germs.

And it's not like there aren't alternatives.  As one might expect in the 21st century, there are electronic/digital stethoscopes.  There are also handheld ultrasounds that provide another strong alternative.

And now, of course, there are smartphone apps for stethoscopes.  Apple was claiming 3 million doctors had downloaded its $0.99 stethoscope app as long ago as 2010, with Android versions also available.  

And yet stethoscopes hang in there.  

We might like to think that physicians continue to use traditional stethoscopes because they are simply being thrifty, since electronic stethoscopes and handheld ultrasounds are much more expensive, but that seems a reach.  They've certainly not been reluctant to adapt other types of newer, more expensive technology -- at least, not as long as they can charge more for it.  

It is a conundrum that has bedeviled economists: why in health care does new technology almost always increase costs, unlike most other industries?  E.g., DVRs were much better than VCRs, but quickly became comparably priced.  Professor Kentaro Toyama cites what he calls technology's Law of Amplification: "Technology’s primary effect is to amplify, not necessarily to improve upon, underlying human inclinations."

And in health care, those underlying inclinations don't drive towards greater value.

When it comes to stethoscopes, it's not about the money.  Many physicians believe that the stethoscope helps foster the patient-physician relationship.  In a recent article in The Atlantic, Andrew Bomback admitted that, "Indeed, for many doctors (myself included), the stethoscope exam has become more ceremony than utility."  

Physician/engineer Elazer Edelman argues that a stethoscope exam can help to create a bond between patients and physicians.  He worries that technology may be fraying the "tether" between doctors and patients. Still, if the relationship depends on which device a physician uses to listen to our chest, that relationship is in bigger trouble than we think.

So, R.I.P. VCRs, and thanks for the memories.  As for stethoscopes, and for health care more generally, though, maybe the moral is that we should focus less on status symbols and more on what is best for patients.

This post is an abridged version of the posting in Kim Bellard’s blogsite. Click here to read the full posting

Friday
Aug122016

Health Benefit Costs for Large Employers โ€“ Up 6% again in 2017

By Claire Thayer, August 12, 2016

This week, the National Business Group on Health released their Large Employers’ 2017 Health Plan Design Survey, with the ‘good’ news that the overall health benefit costs were only expected to increase 6%.  Says Brian Marcotte, president and CEO of the National Business Group on Health, “interestingly, current estimates have health insurance premiums for the average public exchange plan increasing by at least 10%, about twice what large employers are projecting for next year. This is a clear indication that the employer-based health care model continues to be the most effective way to provide health insurance coverage to employees and their families.”

Spending on pharmaceuticals and specialty drugs are contributing factors in the overall growth of health care benefit costs.  The survey reports that overall, 80% of employers placed specialty pharmacy as one of the top three highest cost drivers, followed by high cost claimants (73%) and specific diseases and conditions (61%).

The survey offers highlights of what employees will see during their upcoming open enrollment:

  • Telehealth services on the rise: Nine in 10 employers (90%) will make telehealth services available to employees in states where it is allowed next year, a sharp increase from 70% this year.
  • Consumer-Directed Health Plans (CDHPs) increase slightly: Overall, 84% of employers will offer a CDHP in 2017, up from 83% this year. In addition, more than one-third of employers (35%) will only offer CDHPs to employees in 2017, a slight increase from 33% this year.
  • Spousal surcharges leveling off: One in three employers (33%) will have surcharges in place for spouses who can obtain coverage through their own employer, roughly the same as this year. A few employers will exclude spouses when other coverage is available through an employer.
  • Expanded options at Centers of Excellence grow. The use of Centers of Excellence will grow from 79% this year to 85% in 2017. The largest increases will be for bariatric surgery (up 15 percentage points), transplants and fertility treatments, both up 8 percentage points.
  • Tools to manage care: Eight in 10 respondents (80%) plan to offer nurse coaching for care and condition management while 72% will offer nurse coaching for lifestyle management. Nearly two-thirds (65%) will provide employees with self-service decision-making tools to help them become better health care consumers.
Thursday
Aug042016

A Snapshot of Managed Care Pie

By Clive Riddle, August 4, 2016

MCOL’s Managed Care Fact Sheet webpages are being updated to reflect current data, so I took this opportunity to grab some Facts and provide this preview, baking this snapshot of managed care pie.

National HMO Enrollment is 92.4 million for 2016, up from 85.7 million in 2015, and a recent low of 66.8 million in 2007. The previous high was 81.3 million in 1999, just before managed care backlash whipped the numbers down. (1)

How does the managed care enrollment pie divide up?  33% are enrolled in HMOs, 57% in PPOs, 2% in POS plans and 7% in HDHPs.(1) - (3)  The top five national health plans by enrollment are United Health Group – 48.0 million; Anthem – 39.6 million; Aetna – 23.0 million; Cigna – 15.1 million and Health Care Service Corporation – 15.0 million. (14)

And what portion of the total national pie does managed care represent? 31% of Medicare beneficiaries are enrolled in Medicare Advantage plans, 63% of Medicaid enrollees are in Medicaid managed care plans, and 99% of commercial lives are enrolled in managed care. Factor in the 9% of the population that is still uninsured, and 70% of the total population is enrolled in some form of managed care plan. (4) – (10)

What are current resource use benchmarks in managed care – or how much of the pie is being eaten? HMO Hospital inpatient days per 1,000 members per year are 1,639 for Medicare, 395 for Medicaid and 231 for commercial; Commercial PPO are 237. HMO Physician visits per member per year are 10.2 for Medicare, and 4.8 for Medicaid and Commercial; Commercial PPO are 4.7. HMO Prescriptions per member per year are 29.9 for Medicare, 9.6 for Medicaid and 9.0 for Commercial; Commercial PPO are 11.8. (2) (11)

Getting back to pie, medical cost components – for a family covered by a PPO – are sliced up 31% for inpatient, 30% of physician, 19% for outpatient services, 17% for pharmacy and 4% for other services. (12)

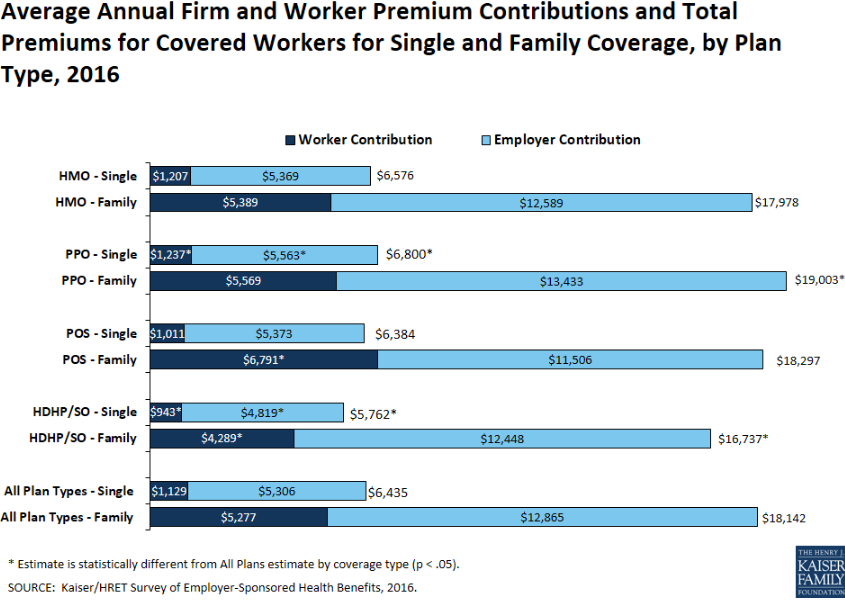
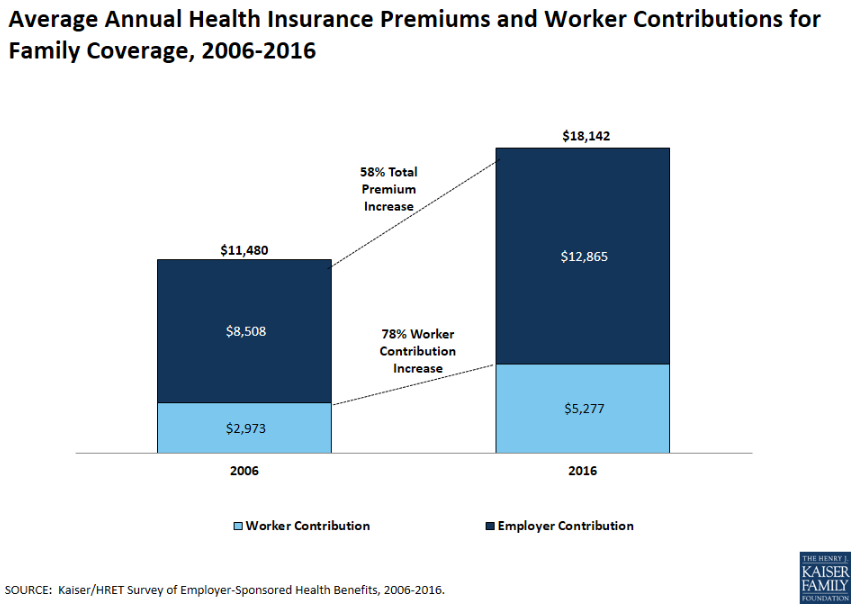
So what does the pie cost? Single health plan premiums average $518 for HMOs and $548 for PPOs, and family premiums average $1,437 for HMOs and $1,539 for PPOs. Premium increases are estimated to be 4.3% in 2016, and have been under 5% after 2011, and under 8% after 2003. In 2002 – post managed care backlash -  they were 14.7%, but they were 8.1% or less in the pre managed care backlash era from 1993 to 2000, including a decrease of 1.1% in 1994.  Before that, double digit increases were the norm for a number of years.

(1) Total HMO Enrollment - Kaiser State Health Facts; Data Source: Health Leaders InterStudy, a Decision Resources Group Company July 2015 Data, accessed August 2016 www.statehealthfacts.org

(2) 2015 HMO-PPO Rx Digest Series, Sanofi www.managedcaredigest.com 

(3) New Census Survey Shows Continued Growth in HSA Enrollment, AHIP November 11, 2015  https://ahip.org/new-census-survey-shows-continued-growth-in-hsa-enrollment/     

(4) CMS Fast Facts: www.cms.gov/fastfacts/  

(5) Medicaid Enrollment Report as of January 2016: https://www.medicaid.gov/medicaid-chip-program-information/program-information/downloads/january-2016-enrollment-report.pdf 

(6) Kaiser Family Foundation State Health Facts Total Medicaid MCO Enrollment http://kff.org/other/state-indicator/total-medicaid-mco-enrollment/ 

(7) CDC Fast Facts, National Center for Health Statistics, Health, United States 2016: http://www.cdc.gov/nchs/ 

(8) Tricare Prime Beneficiaries 2016: www.tricare.mil/About/Facts/BeneNumbers.aspx 

(9) CDC May 2016: Health Insurance Coverage: Early Release of Estimates From the National Health Interview Survey, 2015 http://www.cdc.gov/nchs/data/nhis/earlyrelease/insur201605.pdf  

(10) Total U.S. Population data as of April 2016, U.S. Census Bureau: www.census.gov

(11) 2015 Public Payer Digest Series, Sanofi www.managedcaredigest.com

(12) Milliman Medical Index, Milliman, May 24, 2016 http://www.milliman.com/mmi/    

(13) Kaiser/HRET Survey of Employer-Sponsored Health Benefits, 2015. www.kff.org

(14) MCOL research from 2016 company reports

Monday
Jul252016

Common Culture โ€“ A source of strength for integrated delivery systems 

By Cathy Eddy, Health Plan Alliance, July 25, 2016

On July 20, I had the opportunity to be part of a discussion that American Hospital Association and Sharp Healthcare hosted in San Diego for integrated delivery systems with health plans. I was asked to facilitate an exchange on key trends in product innovation.

During the day the discussion hit on many of the national trends we are seeing in our work with health plans around the country:

  • Strategic Value
  • Growth
  • Changes in Ownership
  • Alignment and Intersection
  • Government Oversight

During my session, we went into depth about the need for alignment between payers and providers and the key intersection points where health systems and their provider-sponsored health plans need to work in tandem to be successful. These areas are:

  • Governance
  • Customer experience
  • Contracting strategy
  • Risk adjustment
  • Quality metrics
  • Clinical integration
  • Informatics and analytics
  • Technology assessment and IT infrastructure

Jim Hinton, President & CEO, Presbyterian Healthcare Services who chaired the meeting, suggested I add a slide about Culture, another area that is a key to success. He shared that his team will call out when the word “side” is mentioned. I’ve been on the Presbyterian Health Plan board for 10 years and the organization does a great job of looking at its challenges and opportunities from a system point of view. We have an annual planning retreat with the system and health plan boards that contribute to a common culture at the governance level.  Jim’s comment reminded us that words matter.  So does culture.

Mike Murphy, CEO of Sharp Healthcare, led a discussion with a team of his executives including Melissa Hayden Cook, the CEO of Sharp Health Plan. They did a great overview about how they work as an integrated health system. This organization has built the “Sharp Experience” that drives a common culture. For the past 15 years, Sharp has held annual all-employee meetings  – three sessions where 17,000 employees, 2,600 physicians and 2,000 volunteers are invited to take a bus trip to the convention center and recommit to Sharp Healthcare and their role with the system. Their vision: To be the best health care system in the universe!

Integrated Delivery Systems often include several business models and that can result in different cultures. The language of a health plan is different than the one used by providers. The meaning given to the same words can be different – for instance, revenue. In a health plan, revenue comes from premium dollars, but payers see provider revenue as a cost. Roles can have the same title, but different responsibilities  -- care manager is just one example. It is a challenge for our integrated delivery systems to develop a common culture.  Kudos to Sharp and Presbyterian for the work they have done in this arena.

Value-based payments will drive the need for collaboration. Population health focuses on the care continuum. The customer experience is often a reflection of the system’s culture…positive when everyone is working with a common set of values and negative when the hand-offs are confusing and disjointed. As we strive to successfully integrate providers and payers, the value of a common culture can be an important key to success.

So how healthy is your culture? Listen carefully to see the words that are a part of conversations in your health system to see if you are thinking like an integrated system.

This post originally apperared on the Health Plan Alliance Blog on June 28th, 2016. You can see the original at http://www.healthplanalliance.org/News/166/Common-Culture--A-source-of-strength-for-integrated-delivery-systems and see all the Health Plan Alliance Blog posts at http://www.healthplanalliance.org/hpa/Blog.asp

Monday
Jul252016

Connecting individuals to complex health care fraud schemes

By Claire Thayer, July 25, 2016

The U.S. Department of Justice has been busy in tracking down and convicting criminals in health care fraud related crimes.  This week, the U.S. Department of Justice announced its largest criminal healthcare fraud case against individuals in $1billion Medicare fraud scheme. This follows U.S. Department of Justice news on June 22, 2016, of an unprecedented nationwide sweep led by the Medicare Fraud Strike Force in 36 federal districts, resulting in criminal and civil charges against 301 individuals, including 61 doctors, nurses and other licensed medical professionals, for their alleged participation in health care fraud schemes involving approximately $900 million in false billings.  In addition, the HHS Centers for Medicare & Medicaid Services (CMS) is suspending payment to a number of providers using its suspension authority provided in the Affordable Care Act.  This coordinated takedown is the largest in history, both in terms of the number of defendants charged and loss amount. 

An OIG report published earlier this year found that in FY 2015, FBI efforts resulted in over 625 operational disruptions of criminal fraud organizations and the dismantlement of the criminal hierarchy of more than 144 health care fraud enterprises.  These and other findings are the focus of a recent MCOL infographoid, co-sponsored by LexisNexis Health Care, highlighted below:

MCOL’s weekly infoGraphoid is a benefit for MCOL Basic members and released each Wednesday as part of the MCOL Daily Factoid e-newsletter distribution service – find out more here.

Thursday
Jul212016

What Pokรฉmon Go Means for Health Care

By Kim Bellard, July 21, 2016

In recent days there have been a flood of stories trying to explain the Pokémon Go craze.  
Many -- e.g., The New York Times and Fast Company -- believe that Pokémon Go is finally going to make augmented reality mainstream, as well as showing AR's advantages over virtual reality, since the latter typically requires at least a headset plus a high powered PC.  It makes AR quick, easy, and free, teaching players how AR can seamlessly fit into the real world.

The game has players wandering around their neighborhoods, their eyes torn between their phones and the real world, visiting places they never stopped at before and meeting people they might never have talked to before.  People are already talking up the game's health benefits.  The New York Timesreports that it "has kids on the move."  More importantly, when people are playing the game they are not sitting passively behind a screen in their house.

Pokémon Go is not, by itself, going to lead to dramatic improvements in the nation's health.  Nor was it intended to.  It is, however, yet another example about we can use games, or at least gamification, can help us with our health.

However promising gamification in health care may be, it is the AR that may well hold the most promise for health care.  Google was not wrong to pursueGoogle Glass, just premature.  Pokémon Go may be signaling that we're now finally ready for AR, and that it will be consumers as well as professionals who can benefit from it.

The potential uses in health care are virtually endless, but here are a few examples:

  • Ever been lost in a hospital, meandering haphazardly despite various signs and color-coded arrows?  How much better would an AR map be?  
  •  Ever feel like your doctor spends too much time staring at your chart or a screen?  Instead of looking there for information about you, how much better would it be if he/she was looking at you, with AR notations for key information about you?  
  •  Ever not understand what your doctor is telling you about your diagnosis or treatment?  It is well documented how few patients leave their doctors office/ER/hospital understanding what they were told.  How much better it would be if your phone could listen to the conversation, and provide AR "translations" into layman's terms of what is being said?  
  • Ever been told you needed a prescription, a test, or other treatment, and wondered how much it might cost?  You might have even asked your doctor, who most likely doesn't know either.  How much more powerful transparency efforts would be if those prices showed up as AR in the place of service at the time of the discussion about them, again with both the patient and the doctor seeing them?
  • Ever make "bad" food choices, despite calorie and nutritional information more omnipresent on labels and menus?  How much better would an interactive AR display of the information be?

Health care has no shortage of information.  Its problem is more making that information accessible to the right people, at the right time.  This is the real potential of AR, and figuring out how to do so in as impactful yet unobtrusive way will be the challenge for developers.

Pokémon Go is not the model for the future of health care, but it offers a model for it we should be paying attention to.

This post is an abridged version of the posting in Kim Bellard’s blogsite. Click here to read the full posting

Tuesday
Jul192016

Cost of a data breach in health care reaches $355

By Claire Thayer, July 19, 2016

The Ponemon Institute released a few new reports this summer on the cost of data breaches as well as ability of companies to adequately mitigate online incidents and cyber attacks. While the reports cross all major industries, noted below are a couple of important highlights pertaining to healthcare.

In terms of analyzing external threats that arise outside the company’s traditional security perimeter, and use of online channels – email, social media, mobile apps, or domains, as primary attack vehicles, a July 2016 Ponemon Institute report finds that only 29 percent of respondents in health and pharma believe they indeed have the necessary tools and resources to mitigate external threats:

In addition to concerns on how best to mitigate external threats, the Ponemon Institute’s  2016 Cost of a Data Breach Study finds that the average global cost of a data breach per lost or stolen record reached $355 for healthcare, compared to $158 for all industries. 

The complete Ponemon Institute 2016 Global Cost of a Data Breach Study includes:

  • The average costs and consequences related to experiencing a data breach incident.
  • Seven global mega trends in the cost of data breach research.
  • The most common factors that influence and can limit the cost of a breach.
Friday
Jul152016

CMS Office of the Actuary on Health Expenditure Projections

By Clive Riddle, July 15, 2015

Where are US health care cost increases headed? The CMS Office of the Actuary tells us to expect 5.8 percent annual increases during 2015-2025, in their report: National Health Expenditure Projections 2015-2025.

The Office of the Actuary states “health spending is projected to grow 1.3 percentage points faster than Gross Domestic Product (GDP) per year over 2015-2025; as a result, the health share of GDP is expected to rise from 17.5 percent in 2014 to 20.1 percent by 2025. Federal, state and local governments are projected to finance 47 percent of national health spending (up from 45 percent in 2014).”

The report findings include:

  • National health spending growth is estimated to have been 5.5 percent in 2015.
  • By 2016, slower growth in health spending of 4.8 percent is projected as the enrollment in Medicaid and Marketplace plans slows and the associated declines in the number of the uninsured decreases.
  • Total annual health care spending growth is expected to average 5.8 percent over 2015-2025.
  • In 2015, medical price inflation slowed to 0.8 percent, down from 1.4 percent in 2014. Hospital prices increased by 0.9 percent while price growth in physician services fell by 1.1 percent.
  • The share of health expenses that Americans pay out-of-pocket is projected to decline from 10.9 percent in 2014 to 9.9 percent in 2025.
  • The insured share of the population is expected to continue to rise from 89 percent in 2014 to 92 percent by 2025.
  • Private health insurance expenditures are estimated to have increased by 5.1 percent from 2014 to 2015, reaching $1.0 trillion and will grow 5.4 percent thereafter to 2025.
  • Medicaid spending growth is slowing significantly in 2016, to 5.3 percent, which the report attributes to slower enrollment growth and stronger utilization management.
  • Medicaid spending growth is expected to average 5.6 percent for 2017-19, lower than in 2014-15.
  • In 2015, Medicare expenditures are expected to have been $647.3 billion, a 4.6-percent increase from 2014, driven partly by increased enrollment.
  • Medicare per-enrollee costs are estimated to have increased by only 2.4 percent, the same as the previous year, continuing the recent trend of low per-enrollee cost increases.
  • Prescription drug spending is projected to grow an average of 6.7 percent per year for 2016 through 2025. This follows growth of 12.2 percent in 2014 and 8.1 percent in 2015
Tuesday
Jul122016

Factors attributed to medication non-adherence

By Claire Thayer, July 12, 2016

Medication non-adherence has a huge impact on overall public health. Isolating factors attributed to nonadherence presents opportunities for providers and pharma organizations to not only step up to improve patient health outcomes, but also eliminate wasted medications. An Express Scripts study on this topic found that 69% of medication nonadherence is due to behavioral issues, for a variety of reasons such as forgetfulness or procrastination, 16% of nonadherence was due to cost, and 15% say that medication side effects contributed to non-adherent behaviors.

These and other findings are the focus of a recent MCOL infographoid, co-sponsored by LexisNexis Health Care, highlighted below:

MCOL’s weekly infoGraphoid is a benefit for MCOL Basic members and released each Wednesday as part of the MCOL Daily Factoid e-newsletter distribution service – find out more here.

Friday
Jul082016

How much of a game-changer is MACRA and the MIPS and APM paths?

By Clive Riddle, July 8, 2016

That is the question asked of panelists in the current edition of MCOL’s ThoughtLeaders. Here, in its entirety, is a response from one of the panel: Mark E. Lutes, Chair, Board of Directors / Member of the Firm, at Epstein Becker Green.  Actually, here’s the question posed in its entirety: “How much of a game-changer is MACRA and the MIPS and APM paths going to be for Medicare, and will Medicaid or Commercial programs adopt similar approaches for applicable segments?”

So here’s what Mark had to say in response:

MACRA represents a laudable attempt to replace the truly failed SGR with an approach that seeks to do the right thing, which is to reward quality and efficiency at the individual practice level. Though it has some challenges and, like most major policy changes, will require plenty of tweaking once implemented in real world situations. MACRA is likely to be a game changer but, as per usual, not in the direct ways that Congress/CMS may have anticipated or hoped.  Thus, MACRA, like HiTech and dozens of other pieces of legislation before it, is most likely to illustrate that the "law of unintended consequences" is the most predictable result of Washington DC legislative and regulatory action.

A few illustrations-the availability of the APM v the MIPS pathway was hoped to induce more rapid adoption of risk assuming payments.  If CMS had seen fit to provide more of a glide path toward APM qualification, the "brass ring" of Medicare payment increases via APM qualification might well have "lit a fire" under segments of the provider community seeking to avoid the uncertainties of MIPS based fee schedule increases.  However, the draft rule puts that brass ring out of reach for most medical groups, ACOs, IPAs, and PHOs.  Thus, one of the key "game changing" opportunities of MACRA is likely to be missed.  As it did with ACOs, where it demanded provider investment to produce savings that benefited the Medicare program and then put limits on the providers' opportunity to garner the reward for their efforts, CMS is in danger of missing the golden opportunity to incent a stampede toward APMs by making the "perfection" in risk assumption the enemy of the "good" in the way of progress towards that end.

In fact, in the proposed rule, CMS averts its eyes from the efforts of many physicians to achieve value through managed care programs. The rule only gives credit for activities physicians are conducting in the fee-for-service realm. One thing to watch is a report CMS is due to issue by July 1 as required by Section 101(e)(6) of MACRA on the feasibility of integrating the APM concept in the Medicare Advantage payment system. And, unfortunately, there's no credit given for non-Medicare APM activity until 2021.   

Likewise, because MIPS allows providers a great deal of choice in metrics upon which to be measured, it will not drive change across other payor streams.  There are too many choices for other payors to expect that their provider networks will be geared up to report any particular subset around which financial incentives might be built.  It may be more realistic to hope that consensus, adoptable in a range of payment programs will come instead out of the joint payor/CMS work in the Health Care Payment Learning & Action Network (LAN).

In several years, looking back on the run-up to the payment impacts, MACRA is likely to be seen to have been a game changer-in two ways that are not within the story line.  First, MACRA is likely to be regarded as an instigating event in physician practice consolidation, through the expansion of hospital employment, insurer physician practice transactions, specialty group growth and physician practice Management Company ventures 2.0.  Even if the individual MIPS measures are viewed by individual and small groups of physicians as doable in the near term, there will be mental energy burned to comprehend them, software upgrades to support their reporting, and there will be a growing fear of the unknown as the resource use measures evolve.  Therefore, probably the most predictable and predominate result of MACRA will not be the instigation of quality improvement and enhanced attention to resource use which the federal government intends, but another "nail in the coffin" of small scale medical practice.

Second, MACRA is likely to be regarded as a watershed moment wherein the fee-for-service Medicare program took on (or even exceeded in granularity) the incentives present in managed care.  Previously, a physician practice opted in to payment for performance.  PQRS and meaningful use had been, to date, largely reporting incentives and ACO downside risk was both voluntary and relatively rarely attempted.  The dawn of MACRA might be seen as CMS crossing the line from being a passive payor to being a demanding customer that changes the specifications of its order and settles it bill according to data it controls well after the date of service.

Note: Mark will be participating in the faculty in a webinar on this topic, along with EBG's Lesley Yeung and EBG Advisors' Bob Atlas in the HealthcareWebSummit event on Thursday August 4th, 2016 at 1 PM Eastern : Preparing for MACRA - The Next Steps: Composite Scoring, Performance Considerations, Implications and More.

Thursday
Jun302016

When the Disruptor is the Disruptee

By Dennis Bolin, Health Plan Alliance, June 28, 2016

I don’t know about you but I am becoming tired of hearing about “disruption” in the health insurance industry. I hear and read the term everywhere and I wonder if it is overused. I just returned from this year’s AHIP Institute and I heard the term repeatedly in presentations and discussions. Whether the word used is “revolution,” “transformation,” “innovation,” or “reimagining,” the pressure to integrate to “make it happen” is mounting. Clayton Christensen defines “it” as “combining, through a coordinated effort, the business models that must comprise the disruptive value network.”

The concept of disruption as a business strategy has been popularized by Christensen’s work. We had a member of his firm present at an Alliance meeting years ago – when the concept was still new – and we have been following the evolution ever since. In his book on the health care industry The Innovator’s Prescription Christensen says health care disruption is likely to come from 3 sources: 

  • Employers 
  • Corporate orchestrators
  • Integrated fixed-fee providers

Employers

At the Alliance’s recent Health System/Health Plan Value Visit we discussed with a Boeing executive that company’s initiatives to wrestle with health care costs, standardize quality and improve the customer experience. While we have heard about the strategy from Alliance member Providence Health Plan, I gained insights hearing it from the employer’s perspective. They have rolled out their strategy to a second market and anticipate a third market in 2017. In each case they identified a delivery system and provider network as their partner, driving costs, innovation and market share. More of our system owners are hearing directly from employers.

Corporate orchestrators

New entrepreneurial, venture capital-backed companies – corporate orchestrators – are also reshaping markets. Four are receiving a lot of attention:

  • Oscar. Now in 4 states (New York, New Jersey, Texas and California) and 140,000 members Oscar is changing the market by introducing a technology-driven consumer-friendly product. I met with the CEO of Oscar 4 years ago when all they had was a group of programmers in a nearly empty loft in SOHO. Only 2 of the senior team came from the health insurance industry and they were sure they could do it better. An example:  a PCP receives a real-time text message of a member in an emergency room with a pin number used to call the member. The physician is paid $24 to call the patient within hours.
  • Clover. A Medicare Advantage plan, they anticipate targeting only a small number of states. They are differentiating themselves through the use and availability of data. Using a cloud structure they do not have to worry about systems talking to each other. Instead data is deposited and accessed according to agreements on guidelines of usage.
  • Harken Health. Their model is focused on primary care centers and offer insurance to small groups and individuals on and off the exchange. They currently are in Chicago and Atlanta. United is an investor.
  • Bright Health Inc. They are unique in that as an insurance company they partner with a single provider system in the market to drive market share and partner to offer affordability and a differentiated customer experience. They anticipate entering the Colorado market in 2017.

Integrated Fixed-fee Providers

Christensen says that the challenge for integrated fixed-fee providers, such as Alliance members is that we are both the disruptee and the disruptor. In other words we are turning our own business and care models on their heads. In a truly integrated system the incentives are to keep people well. But flipping the switch on our business is not easy in ways the start-up disruptors can build from scratch. But we have one advantage:  we have all the components while none of the start ups do.

And integrated systems have the components necessary to create an enhanced enterprise-wide customer experience. Chris Fanning with Geisinger Health Plan shared their enterprise approach to customer experience at our Health System/Health Plan Value Visit. He will be going in-depth on their enterprise-wide Member Journey Roadmap at our Customer and Employer Market Strategies Value Visit July 19 – 21, click here for event information.  Geisinger has identified guiding principles around which they are organizing their customer-centered initiatives:

  • Navigate – helping members make their way through the health system and make decisions right for them.
  • Anticipate – help members know what to expect and help them with their needs in advance.
  • Simplify – make the health system, health plan, and physician groups easier to do business with.
  • Earn Trust – help members select the right plan based on their needs and work closely to resolve issues and assist beyond the traditional payer role.
  • Individualize – Customize and personalize information and communication to meet specific interests and needs

As Christensen counsels, being the disruptee as well as the disruptor is a demanding but not an impossible expectation. He points out that integrated fixed-fee providers are uniquely positioned to shift care to the most cost effective site possible, to coordinate care, to manage a population’s health, to give tools to consumers to make decisions and manage their health and to provide a distinctive customer experience. And every time Alliance members gather to discuss our initiatives we get more disruptive.

This post originally apperared on the Health Plan Alliance Blog on June 28th, 2016. You can see the original at www.healthplanalliance.org/News/160/When-the-Disruptor-is-the-Disruptee and see all the Health Plan Alliance Blog posts at www.healthplanalliance.org/hpa/Blog1.asp

Friday
Jun242016

Millennials Are (Not) So Different

By Kim Bellard, June 24, 2016

If we believe conventional wisdom about them, they like to live with their parents, at least until they can move into their urban-center condo.  They hate to drive.  They're maddening in the workplace, demanding lots of frills and constant praise yet returning little loyalty.  They're hyperconnected through their various digital devices.  And, when they deign to think about health care, which isn't often, they want all digital, all the time. 

There's some truth to the conventional wisdom, but not as much as you'd think.  A new study from Credit Karma flatly asserts that "everything you thought you knew about Millennials may be wrong," finding that they still have aspirations to much of the same "American Dream" as previous generations.   

The hyperconnected part is certainly true.  Millennials are much more likely to have a smartphone,  and -- jawdroppingly -- on an average day they interact with it much more than with anyone else, even their parents or significant other.  

Things get really interesting when it comes to health.  Millennials are often viewed as not very interested in health care, but it is the second most important social issue for them, right after education and ahead of the economy. 

deep dive on millennials and health care by the Transamerica Center for Health Studies had some results that also don't necessarily fit the stereotypes. Taking care of their health was tied with getting/keeping a job as their top priority. 70% have been to a doctor's office within the last year, although for minor issues they're more likely to head to urgent care/a retail clinic. When it comes to getting health information, this supremely digital generation still relies most heavily on health care professionals and friends/family (especially their mothers!).

There has been a dramatic drop in being uninsured -- 11% versus 23% as recently as 2013 -- but millennials don't like much about health insurance.  They feel much more informed about their health and how to improve it than they do about how to find health care services or their health insurance options.  

Perhaps that is why two-thirds have never comparison shopped for health insurance.

Lastly, TCHS found that millennials rate affordability as the most important aspect of the health care system, but many don't find it affordable.  About 20% can't afford routine health expenses, even though millennials' median health expenses are under $100 per month.  Nearly half have skipped care to reduce their expenses. Similarly, most millennials view monthly premiums over $200 as unaffordable.

If there is a key difference with millennials' health care, it may be in their emphasis on technology.  A report from Salesforce.com found that 76% of millennials valued online reviews in choosing a doctor, and 73% want doctors to use mobile devices during appointments to share information. 60% are interested in telehealth options in lieu of office visits.

It is perhaps no wonder millennials are turning to technology when it comes to their health.  They highly value face time with their doctor, but they may not be getting it.  According to the Salesforce report, 40% of millennials don't think their primary care doctor would recognize them on the street. 

Many of us might suspect the same thing, and that should trouble us all.

When it comes to health care, as with many other aspects of life, it may be less that millennials are different in what they want as it is that they're quicker to adopt newer options for getting it.  The rest of us should learn from that, not shake our heads at it.

This post is an abridged version of the posting in Kim Bellard’s blogsite. Click here to read the full posting

Thursday
Jun162016

Two Thirds of Healthcare Stakeholders Have Faith in Consumers Using Online Tools to Engage With Their Doctor

By Clive Riddle, June 16, 2016

MCOL has conducted an e-poll, co-sponsored by Keenan, of healthcare business stakeholders regarding their opinion on consumer tools involved with healthcare costs or quality. Key questions were asked regarding consumer healthcare cost and quality tools; and ranking of applicable items with respect to overall effectiveness.

68.5% of stakeholders believe it is likely or very likely that a typical consumer will use online data/comparisons to discuss options and costs with a provider. Stakeholders not involved with online tools have a greater belief that consumers are very likely to do so (34.8% compared to 18.6% of stakeholders that are involved with online tools). However, stakeholders involved with tools have an overall greater belief that consumers are likely to do so – combining likely plus very likely responses (72.1% for involved stakeholders compared to 65.2% for stakeholder not involved with tools.)

44.4% of stakeholders feel a smartphone is the optimal vehicle to deliver such tools, while 34.7% feel a computer desktop is the optimal vehicle, and 13.9% listed a tablet such as an iPad as the optimal vehicle. Stakeholders not involved with online tools were less likely to list a computer desktop (21.7% compared to 38.1% for stakeholders involved with tools and 57.1% for stakeholders not sure if they are involved). However smartphones were the top choice for both stakeholders involved with online tools, or not involved with online tools.

Given five types of tools to rank for effectiveness, stakeholders preferred health insurance out-of-pocket costs calculators and healthcare service price estimator/comparisons. Given seven issues to rank by level of concern, relating to consumer tools, stakeholders were most concerned by accuracy/credibility of data sources, and consumer ability to understand/use tool correctly.

58.9% of stakeholders indicated they are involved with consumer tools, while 31.5% responded they are not involved, and 9.5% were not sure. The online survey of healthcare business stakeholders was conducted during May 2016 by MCOL.  Survey participants received a detailed report on the survey results.

As Tim Crawford, a Vice President from Keenan puts it, “if we want to bend the healthcare cost trend downward by making patients and their families more effective consumers, we will need to equip them with the information they need to make informed decisions. Consumers of medical services will need to know about the quality of their providers and understand the total costs involved. More than two-thirds of those responding to the survey believe that consumers will use tools that give them this information and will use the knowledge to discuss options and costs with their providers. Ideally, such tools can provide the common ground needed for patients and physicians to have a transparent dialog about medical decisions.”

Tuesday
Jun072016

Insurance spending on behavioral health: Up for Mental Health / Down for Substance Use

By Claire Thayer, June 7, 2016

The June 2016 issue of Health Affairs takes a deep dive into behavioral health from several different vantage points, including public and private health spending, veteran’s mental health service use, quality measurement, mental illness and gun violence, drug monitoring, suicide prevention, along with trends in media coverage.

Here are a few highlights of several of the articles in the June 2016 issue:

On the health spending spectrum, a long-term longitudinal Health Affairs study finds a increase in the total mental health treatment expenditures financed by private insurance, Medicare, and Medicaid increased from 44 percent in 1986 to 68 percent in 2014. While the share of spending for substance use disorder treatment financed by private insurance, Medicare, and Medicaid showed almost no increase, was 45 percent in 1986 and 46 percent in 2014.

Another article in the June 2016 issue examines gun violence, gun-related suicide and violent crime in people with serious mental illnesses, and whether legal restrictions on firearm sales to people with a history of mental health adjudication are effective in preventing gun violence.

State prescription drug monitoring programs were reviewed based on findings from a national survey to assess the effects of these programs on the prescribing of opioid analgesics and other pain medications in ambulatory care settings. In this study overview, researchers found that the implementation of a prescription drug monitoring program was associated with more than a 30 percent reduction in the rate of prescribing of Schedule II opioids.