Medicare Part D Premiums and Enrollment by the Numbers
By Clive Riddle, August 9, 2018
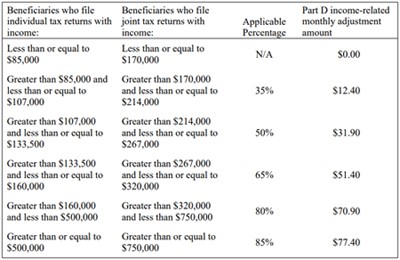
CMS this week announced that Part D premiums are expected to fall from $33.59 this year to $32.50 in 2019. Of course it’s not that simple. First of all, $32.50 is the “basic” premium rate. What Medicare beneficiaries actually pay is income adjusted on a sliding scale. Here are the 2019 “income-related monthly adjustment amounts” just released by CMS:

CMS informs us that:
- “the base beneficiary premium is equal to the product of the beneficiary premium percentage and the national average monthly bid amount”
- "the national average monthly bid amount is a weighted average of the standardized bid amounts for each stand-alone prescription drug plan and MA-PD plan.. The weights are based on the number of enrollees in each plan."
- “The national average monthly bid amount for 2019 is $51.28.”
- “The beneficiary premium percentage (“applicable percentage”) is a fraction, with a numerator of 25.5 percent and a denominator equal to 100 percent minus a percentage equal to (i) the total reinsurance payments that CMS estimates will be paid for the coverage year, divided by (ii) that amount plus the total payments that CMS estimates will be paid to Part D plans based on the standardized bid amount during the year, taking into account amounts paid by both CMS and plan enrollees.”
- Using the above calculations “the Part D base beneficiary premium for 2019 is $33.19”
- Then the Income-Related Monthly Adjustment Amounts “are determined by multiplying the standard base beneficiary premium by the following ratios: (35% − 25.5%)/25.5%, (50% − 25.5%)/25.5%, (65% − 25.5%)/25.5%, (80% − 25.5%)/25.5%, or (85 – 25.5%)/25.5%.
Clear as mud?
On the enrollment side of PDP world, here’s a look compiled from July 2018 CMS data:
Here are Medicare national drug plan enrollment totals:
- Total PDP Contracts: 63
- PDP Drug Plan Enrollment: 25,459,900
- MA Drug Plan Enrollment: 18,004,980
- PACE/Cost/Dual Drug Plan Enrollment: 689,113
- Total Drug Plan Enrollment: 44,153,993
The top five states for PDP enrollment penetration are:
- North Dakota – 63.9%
- Vermont – 62.6%
- Delaware – 62.6%
- Iowa – 60.5%
- Wyoming – 58.9%
This compares to a national average of 41.2% penetration. As one might expect, the high PDP penetration states have correspondingly lower Medicare Advantage penetration. For example, North Dakota has 2.7% MA penetration. Conversely, Puerto Rico has only 2.1% PDP penetration, but has the highest MA penetration at 71.1%. (national average MA penetration is 33.8%)
There are 114 counties with PDP penetration rates above 70.0%, mostly concentrated in the above states. Leading the pack is Dubuque County, Iowa at 72.3%. The bottom 77 of the 3,218 counties listed are all in Puerto Rico, as mentioned above. The first mainland county just above them is Clackamas County, Oregon with 17.6% penetration.

 Share This Post
Reader Comments