Search

Entries in Riddle, Clive (397)

Friday
Mar222013

The Alzheimer's Elephant

by Clive Riddle, March 22, 2013

There are so many large, aging elephants in the national room: Social Security, Medicare and Alzheimer's to name three leading the herd. They keep growing larger - we can see it happening in real time - and we've seen it coming for quite some time. Decades ago Ken Dychtwald coined the term Age Wave, referring to the massive shift and implications of the ballooning senior segment of our population.

Robert Egge, the Alzheimer's Association's VP of Public Policy has this to say about Alzheimer's: "Alzheimer's disease steals everything – steadily, relentlessly, inevitably. With baby boomers reaching the age of elevated risk, we do not have time to do what we have always done. The National Institutes of Health needs to reset its priorities and focus its resources on the crisis at our doorstep, and Congress must fully fund implementation of the National Alzheimer's Plan to solve the crisis."

The  Alzheimer's Association this week released 2013 Alzheimer's Disease Facts & Figures, an annual report – this year spanning 71 pages – designed to serve as “a statistical  resource for U.S. data related

to Alzheimer’s disease, the most common type of dementia,  as well as other dementias.”

Here’s some ten key points to consider about the state of Alzheimer's one can glean from the report:

  1. Alzheimer's disease is the sixth leading cause of death in the United States and is the only leading cause of death without a way to prevent, cure or even slow its progression.
  2. 1 in 3 seniors dies with Alzheimer's or another dementia.
  3. Based on 2010 data, Alzheimer's was reported as the underlying cause of death for 83,494 individuals
  4. In 2013 an estimated 450,000 people in the United States will die with Alzheimer's.
  5. Among 70-years-olds with Alzheimer's disease, 61% are expected to die within a decade. Among 70-year-olds without Alzheimer's, only 30% will die within a decade.
  6. More than 5 million Americans are living with Alzheimer's disease.
  7. Without the development of medical breakthroughs that prevent, slow or stop the disease, by 2050, the number of people with Alzheimer's disease could reach 13.8 million.
  8. In 2012, there were more than 15 million caregivers who provided more than 17 billion hours of unpaid care valued at $216 billion.
  9. Due to the physical and emotional toll of caregiving, Alzheimer's and dementia caregivers had $9.1 billion in additional health care costs of their own in 2012.
  10. The total payments for health and long-term care services for people with Alzheimer's and other dementias will total $203 billion in 2013, the lion's share of which will be borne by Medicare and Medicaid with combined costs of $142 billion.

Here's a breakdown provided in the report of 2013 Health and Long-Term Care Services expenditures by source:

  • Medicare: $107 billion (53%)
  • Medicaid:  $35 billion (17%)
  • Out-of-Pocket Costs: $34 billion (17%)
  • Other Sources - private insurance / uncompensated - $27 billion (13%)
  • Total: $203 billion

We’ve all heard the trope “an elephant never forgets.” The irony is, we as a nation are conveniently forgetting the elephant in the room that that in the long term, will rob us of our capacity to remember. 


Friday
Mar082013

High Deductible PPO Plans Versus CDHPs

By Clive Riddle, March 8, 2013

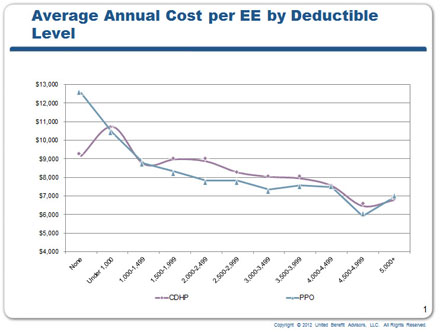
United Benefit Advisors has just released results of their annual health plan survey, with responses from 11,711 employers sponsoring 17,905 health plans nationwide, with results applicable for small to midsize companies. The survey includes a focus on Consumer Driven Health Plan (CDHP) vs. PPO comparisons of premiums, deductibles and enrollment. Their study found that “Consumer-driven health plans (CDHPs) -- high-deductible health plans (HDHPs) often paired with health savings accounts (HSAs) or health reimbursement accounts (HRAs) -- are not achieving long-term savings greater than what would be reached by raising the deductible on traditional PPOs.”

Unlike most national large employer benefit consulting firms, UBA – whose survey concentrated on smaller firms – is not bullish on account based plans, and would rather place their bets on straight PPO plans with a higher deductible. Although one could argue, it might be easy to make a stripped down high deductible PPO health plan yield immediate lower costs than a CDHP that has account administration costs, up-front wellness benefits and other bells and whistles. That doesn’t necessarily mean the PPO HDHP would be the best long term solution for an employer’s and employee’s objectives, unless immediate premium costs is the only concern.

UBA CEI Thom Mangan tells us “Employers are turning to CDHPs as a cost-cutting solution against the relentless upward spiral of health care costs. However, our research shows that small-to midsize businesses in particular, who may be considering these plans may first want to consider increasing the deductible on the plans they already have to achieve the same initial savings. Or, prior to implementing a CDHP plan, employers should build a culture of health and wellness in their workplace that drives employee behavior towards quality, low cost medical care and prescription drugs.”

Here’s some of the data UBA has shared from their findings:

  • Nearly 60 percent of the 11,711 employers surveyed said they plan to offer a CDHP in the next five years
  • PPOs remain the dominant plan type with 61.7 percent of U.S. employee enrollment
  • The greatest savings of a PPO over a CDHP was achieved with a deductible of $2,000-$2,999, where PPO cost per employee was $7,811 and CDHP was $8,859, a savings of $1,000 per employee.
  • Savings created by CDHPs over the plans they were replacing or HSA, averaged 1.75 percent in 2012, a significant reduction from prior years.
  • Enrollment also decreased to 15.6 percent (a 1.8 percent decrease from 2011), and nationwide enrollment among employers with 1,000 or more employees dropped substantially from 15.9 percent in 2011 to 11.3 percent in 2012.
  • The area of the country that has seen the biggest increase in CDHP growth is Minnesota, which saw the percent of employees enrolled in CDHPs increase from 15.5 percent in 2010 to 37.1 percent in 2012, a rate 18.4 percent higher than the national average in those same years.
  • Other areas with rapid CDHP growth include Indiana, Virginia and the Northeast region. The only western state to see CDHP popularity increase was Oregon, where percent of employees enrolled in CDHPs increased from 12 percent in 2010 to 20.3 percent in 2012.
  • Overall, CDHP enrollment in the west is the lowest in the country with only 7.7 percent of employees covered, a slight increase from 7 percent in 2011 and 4.6 percent in 2010. HMOs account for 31.3 percent of the market in the west.
Thursday
Feb212013

The Numbers Behind Plastic Surgery

By Clive Riddle, February 21, 2013

The American Academy of Facial Plastic and Reconstructive Surgery (AAFPRS) has just released results of their annual membership study, which provides a wealth of information about what goes on their world.

Let’s take a peek, with some excerpts compiled from their study:

Cosmetic Procedures: The survey indicated 73% of all procedures were cosmetic  (versus reconstructive) in 2012, up from 62% in 2011. Non-surgical treatments made up two-thirds of all 2012 cosmetic procedures. The most common cosmetic non-surgical procedures remain BOTOX® and hyaluronic acid fillers, with the top three areas of the face most treated by injectables being the forehead (42%), cheeks (35%) and the lips (18%).

Volume and Fees: Member surgeons report performing an average of 945 facial cosmetic surgical, cosmetic non-surgical, reconstructive and revision procedures per surgeon in 2012. Facelifts command the highest average fee per procedure ($7,453, on average), followed by: hair transplants ($7,182), revision surgery ($6,542), and rhinoplasty ($5,541).

Women: 80% of all surgical procedures and non-surgical procedures are performed on women.  Two-thirds of women having procedures are mothers, primarily in their 40's and 50's. In 2012 the most common cosmetic surgical procedure for women was facelifts, followed by blepharoplasty, and rhinoplasty. The most common non-surgical cosmetic procedures among women were BOTOX®, hyaluronic acid injections and microdermabrasion, respectively.

Men: Rhinoplasty remains the most requested surgical procedure overall among men.  On average, 20% of male patients request plastic surgery as a result of their significant other having received plastic surgery. Men had a significant increase in Botox  (up 27% from last year - with hyaluronic acid fillers and microdermabrasion also among the most popular maintenance treatments ) while the number of Botox procedures among women was similar to 2011.

Age Groups: 28% of Facial Plastic Surgeons have seen an increase in cosmetic surgery or injectables in those under age 25. For both female and male patients under the age of 35, the most common procedure performed was rhinoplasty (53% females; 70% males), followed by BOTOX® (30% women; 13% men). For all procedures, except rhinoplasty, the majority were performed on patients between the ages of 35 and 60.

Race: The 2012 survey revealed that African Americans and Hispanics were most predisposed to have received rhinoplasty (80% and 65% respectively). Asian Americans were most likely to have blepharoplasty (44%) or rhinoplasty (41%), while Caucasians were more likely to have facelifts (40%) or rhinoplasty (39%).

Consumer Selection: Most patients get their information about plastic surgery online (57%) and are most concerned with the results of the surgery (40%) followed by concern over the cost (33%)  and recovery time (21%)when making their decision to undergo facial plastic surgery. Last year just 7% of prospective patients used social media to research doctors and procedures, down from 35% in 2011. However, there was a 31% increase in requests for surgery as a result of social media photo sharing.  Surgeons report that, on average, 22 women and 12 men that were dissatisfied with previous rhinoplasty surgery from a different office requested corrective surgery.

Wednesday
Dec192012

TrendSoup: Ten Key Healthcare Business Trends for 2013

By Clive Riddle, December 19, 2012

There may not be a point to ranking the components in a collection of the top trends to impact the business of healthcare in 2013. It can be difficult to say what specific trend singularly will be the most important – beauty may be in the eye of the stakeholder. It would seem that top tier trends all converge and have some degree of effect on each other – kind of like the ingredients of a soup.

So here’s what this chef sees as the ingredient list – in no particular order – of the 2013 TrendSoup for the business of healthcare:

Exchanging Confusion with Public Health Insurance Exchanges

It is not too daring to predict a good deal of confusion will reign for all stakeholders involved with public health insurance exchanges during 2013, as everyone scrambles to prepare for HIX implementation in 2014. Guidance won’t be able to get produced fast enough; guidance won’t anticipate all the scenarios, and a monumental level of decisions and development must be delved into. It won’t be for the faint of heart.

Employer embrace of Defined Contribution Approach

Interest in private HIXs took off during 2012, and even though public HIXs were validated by SCOTUS and the November elections, it is clear that public and private exchanges can co-exist, and that mid-size and large employers are intrigued by utilizing private HIXs to facilitate a switch to defined contributions for health benefits, particularly for those still involved with retiree benefits.

Medicaid Matters: Implications for local Medicaid Plans

Size Matters. Therefore in healthcare, Medicaid Matters. Starting in 2014, the formerly uninsured will shift in sizeable numbers into the Medicaid system. Much attention has been given to the implications for national Medicaid plans – WellPoint acquired Amerigroup – all eyes are on the implications for Centene or Molina. But the real impact, and larger implications, may be spread over the blanket of local, publicly run Medicaid plans throughout the country. The question is – how will the Medicaid Surge transform the local plans?

Early Successes and Failures of Medicare ACOs

With any major new model of care delivery and payments, comes the buildup and the teardown.  So much has already been said about the hopes, dreams and aspirations for what ACOs can do for healthcare. In 2013, enough early experience will exist for Medicare ACOs, that the inevitable examples of big failures will emerge, with pundits and naysayers gleefully parading out their case studies, proclaiming that ACOs are a big bust. Similarly, there will be big successes that will emerge, with pundits and cheerleaders cheerfully parading them out as well.

Employer and Health Plan Embrace of Commercial Accountable Care Arrangements

The real ACO action around the country may be in how major national and regional health plans are investing in building and securing accountable care arrangements with provider organizations for commercial populations. Already a big deal in 2012 – the level of activity will continue to increase in 2013.

Integrated Healthcare Momentum

A greater  number of healthcare systems will either expand their integration efforts, or initiate such steps, with a particular emphasis on medical home development, accountable care arrangements, full system EHR, and some level of administrative capability to function as a payer, while not typically going so far as a licensed commercial health plan.

Hybridization of Employer Worksite Clinics

Onsite workplace clinics continue to gain in popularity among very large employers, to fulfill a number of objectives – reducing costs, improving access, reducing time off work for appointments, implementing a medical home, and many other strategies. But the concept appeals to a wide number of employers that can’t swing implementation due to their size, physical campus logistics, corporate capital constraints or a variety of other issues. 2013 will find development of more hybrid arrangements, such as shared sites between multiple employers or employer coalitions, TPA or health plan sponsored sites for large clients, mobile clinics rotating between sites and other arrangements.

The Convergence of EHR critical mass, readmissions and analytics

A much wider swath of the provider universe now orbits around EHR. Among other EHR implications, 2013 will find many more provider organizations mining their newfound trove of electronic data to conduct analytics, particularly for readmissions management strategies.

Medication Adherence Becomes a Bigger Target

Whether as part of wellness incentive programs, disease management programs, hospital readmissions management, or other care management initiatives; the realization will become even clearer in 2013 that medication adherence may the largest, lowest hanging fruit for stakeholders to focus on, with a wide range of approaches emerging to better address this long-standing issue.

Explosion of mHealth and Emergence of Breakthrough Apps

There’s an explosion of any kind of app, so it follows there’s an ongoing explosion of available healthcare apps. What will also shakeout in 2013 is that a handful of these mHealth apps will gain traction, go mainstream, and will be coming to an iPad near you, this New Year.

Thursday
Dec062012

Healthcare Customer Service and Retention Concepts and Relevant Data Don’t Have to be Specific to Healthcare

By Clive Riddle, December 6, 2012

There can be a mindset within the healthcare industry that management of most core business functions need to be very healthcare specific in order to be relevant. Of course there is truth to that, but sometimes, those within the industry can use healthcare specificity as an excuse for performance levels that might not otherwise be acceptable in other service industries, or as blinders to ignore relevant knowledge and benchmarks that would undoubtedly prove beneficial to the healthcare organization. 

With this in mind, we call your attention to a study just conducted by Accenture, addressing customer service and marketing across ten service industries (including wireless phone, internet service, life insurance and retailers, but not including healthcare). The annual Accenture Global Consumer Survey  pulled together results from 12,000 consumers from 32 countries including the U.S. 

Here are some findings that should have applicability to healthcare, even if the data wasn’t healthcare specific:

  • One in five consumers switched companies they buy from; 85% of consumers say the companies could have done something differently to prevent them from switching
  • 67% pointed to having their customer service issue resolved during their first contact as a factor in switching
  • 54% might have remained loyal if they had been rewarded for doing more business with their provider
  • Broken promises are a top area of frustration for consumers, according to the survey: 63% indicate it’s extremely frustrating when a company delivers a different customer service experience from what it promised upfront
  • 78% of consumers say they are likely to switch providers when they encounter such broken promises
  • 65% are likely to switch when having to contact customer service multiple times for the same reason
  • 65% are likely to switch when dealing with unfriendly customer service agents
  • 61% are likely to switch when on hold for a long time when contacting customer service
  • 48% say that, compared to 12 months ago, they have higher expectations of getting specialized treatment for being a “good” customer
  • 50% say it is extremely important for customer service people to know their history so they don’t have to repeat themselves each time they call
  • 31%  prefer companies that use information about them to make their experience more efficient from one step to the next; but only 24% said their service providers deliver tailored experiences 

Accenture found that, on average, consumers use various channels to learn about and select service providers, including:

  1. Word of mouth, relied upon by 79% of consumers
  2. Corporate websites, used by  71%
  3. Online sources such as expert review sites, news sites and product comparison sites, used by 63% 

Robert Wollan, global managing director of Accenture Sales & Customer Services tells us “the sobering reality is that ‘tried and true’ strategies for customer acquisition, loyalty and retention are struggling to keep pace with consumers who are perpetually in motion, more technologically savvy than ever, and increasingly unpredictable. The news this year is that customers want to be loyal but customer service often fails to meet their expectations. In the digital marketplace, companies must improve social listening capabilities and apply predictive analytics designed to quickly identify and respond to potential customer issues before problems arise.”

Friday
Nov162012

Mercer Weighs in on Employer Health Benefit Cost Projections

By Clive Riddle, November 16, 2012

Here’s what Mercer has to say about the rise in  health benefit costs:  “growth in the average total health benefit cost per employee slowed from 6.1% last year to just 4.1% in 2012. Cost averaged $10,558 per employee in 2012. Large employers – those with 500 or more employees – experienced both a higher increase (5.4%) and higher average cost…. Employers expect another relatively low increase of 5.0% for 2013. However, this increase reflects changes they plan to make to reduce cost; if they made no changes, cost would rise by an average of 7.4%.”

This is based on results from Mercer’s annual National Survey of Employer-Sponsored Health Plans, which includes public and private organizations with 10 or more employees; with 2,809 employers responding in 2012. The full survey results will be released in April 2013.

 How does this compare to what other major human resources/benefits consulting firms are estimating? Here's what we reported in our Tidbits column in the October 6th edition of MCOL weekend:

Aon Hewitt reports that "the average health care premium rate increase for large employers in 2012 was 4.9 percent, down from 8.5 percent in 2011 and 6.2 percent in 2010. In 2013, however, average health care premium increases are projected to jump up to 6.3 percent."  Towers Watson's survey "projects a 5.3% net increase in total health benefit plan costs after any plan changes are taken into account, increasing the average cost per active employee from $10,925 in 2012 to $11,507 in 2013. Of the 2013 total, employees will pay an average of $2,596, or 22.6%, up from $2,436 in 2012." The Segal Company  projects 8.8% increases in 2013 for open access PPOs (10.0% in 2012; 8.2% increases in 2013 for HMOs (9.6% for 2012) and 9.1% increases in 2013 for HDHPs (10.4% in 2012.)

Mercer makes particular note of the impact of CDHPs in the employer benefit arena. They state that “with a growing number of employers now positioning a high-deductible, account-based consumer-directed health plan as their primary plan – or even their only plan – employee enrollment jumped from 13% to 16% of all covered employees in 2012. Many employers see these plans as central to their response to health care reform provisions that will raise enrollment. Over the past two years, offerings of CDHPs have risen from 17% to 22% of all employers, and from 23% to 36% of employers with 500 or more employees. Well over half (59%) of very large organizations (20,000 or more employees), which typically offer employees a choice of medical plans, now offer a CDHP. With the cost of coverage in a CDHP with a health savings account is about 20% lower, on average, than the cost of PPO coverage – $7,833 per employee compared to $10,007 -- employers are increasing willing to make the CDHP their primary or even their only plan. Among large employers that offer an HSA-based CDHP, average enrollment rose from 25% to 32% in 2012. And, when asked if they expect to offer a CDHP five years from now, 18% of large employers say they expect to offer it as the only plan, up from 11% in 2011.”

Friday
Nov022012

Accenture on Independent MDs in the near future: Fewer of Them; With More Performing Subscription Based Services

By Clive Riddle, November 2, 2012

Accenture has just released a new report: Clinical Transformation: New Business Models for a New Era in Healthcare. They found that  “over the past decade, the number of independent U.S. physicians has dropped dramatically, from 57 percent in 2000 to 39 percent in 2012. By the end of 2013, Accenture predicts this number will likely drop further, to 36 percent.” More interesting, it that “by the end of 2013, Accenture also estimates that one-in-three doctors remaining independent will offer patients with subscription-based services, such as telemedicine or online consultations, for sustaining profit – a trend that is expected to increase three-fold over the next three years.”

Accenture’s Kaveh Safavi, M.D., J.D., tells us “More independent physicians are offering subscription-based services as a way for patients to customize their care experience. Meanwhile, patients appreciate the opportunity to supplement their existing coverage with premium, subscription-based services, such as same-day appointments and online prescription refills.”

While this blends with concierge medicine concepts, but the possibilities for what physicians potentially could develop as supplemental premium services could be quite interesting. Of course, for those doctors under health plan managed care contracts preventing balance billing, chartering into premium service waters might require considerable navigation.

Here are some other findings from the Accenture physician survey:

  • 87 percent of physicians surveyed cited the cost and expense of running a business as a chief concern.
  • 65 percent joining health systems said they expect to make the same or less compensation than in private practice.
  • 61 percent cited business operations as a main reason for seeking hospital employment rather than remaining independent.
  • 53 percent cited electronic medical record requirements as a main reason for leaving private practice.
Friday
Oct262012

Reporting from the Healthcare M&A Frontlines: Irving Levin

By Clive Riddle, October 26, 2012

Irving Levin Associates has released quarterly merger & acquisition data from two reports they have just published: The Health Care M&A Report, covering the various healthcare sectors, and The Hospital M&A Market Report, Third Edition, 2012.

According to Irving Levin, activity declined during the past quarter. Stephen M. Monroe, Partner at Irving Levin Associates tells us, “historically, the third quarter is usually the slowest quarter of the year, but with the continued economic turmoil in Europe combined with the uncertainty of the 2012 presidential election in the U.S., there has been more caution in the health care market…. Two large managed care acquisitions made up more than half of the total dollars spent in the health services M&A market in the third quarter, and there really were no other dominant deals like that in any of the other sectors, whether technology or services,” according to Mr. Monroe.”

Irving Levin cited the total activity amounted to $38.2 billion in transactions, with managed care comprising 32% of the dollars, pharmaceuticals 24%, Home Health & Hospice 12% and the remain 32% spread among all other segments.

With specific respect to the hospital market, Irving Levin reports that “the Hospital M&A market was continuing its post- recession rebound, but lately it has been slumping in terms of dollars committed.”

Here are data tables Irving Levin has shared regarding M&A activity:

The Health Care M&A Market – Deal Volume By Sector

Sector Q3:12
Deals*
Q2:12
Deals
% Change Q3:11 Deals % Change
Services Segment:  
Long-Term Care 52 36 44% 43 21%
Hospitals 11 23 -52% 16 -31%
Physician Groups 8 21 -62% 28 -71%
Labs, MRI, Dialysis 21 10 110% 6 250%
Managed Care 6 9 -33% 5 20%
Home Health Care 9 6 50% 6 50%
Behavioral Health Care 3 4 -25% 1 200%
Rehabilitation 3 3 0% 6 -50%
Other 22 24 -8% 21 5%
Services Subtotal 135 136 -1% 132 2%
Technology Segment:  
Medical Devices 19 44 -57% 50 -62%
Pharmaceuticals 19 29 -34% 24 -21%
e-Health 25 24 4% 21 19%
Biotechnology 18 22 -18% 12 50%
Technology Subtotal 81 119 -32% 107 -24%
Grand Total 216 255 -15% 239 -10%    


Hospital Mergers and Acquisitions January 1, 2007 – June 30, 2012 

Year

Number of
Transactions

Dollar Volume of
Transactions

2007

60

$9,172,000,000

2008

60

$2,502,000,000

2009

50

$3,777,000,000

2010

76

$4,289,000,000

2011

90

$9,905,000,000

2012 6 Months

47

$812,500,000

Friday
Sep072012

How are Providers Managing the Transition with Conflicting Incentives in Payment Structures?

Clive Riddle, September 7, 2012

In the just released September issue of Accountable Care News,the monthly subscription newsletter covering Accountable Care, a thought leader panel was asked: “Given the conflicting incentives of ACO and other FFS lines of business, how are providers managing the transition? Stratifying patient populations based on payment incentives? Managing all patients the same and absorbing the revenue losses? Structuring compensation differently for care team members and individual physicians?

It’s an interesting question. Here’s what the Accountable Care News thought leaders had to say about this issue:

Joel C. Hoffman, ASA, MAAA, FCA, Senior Vice President, OptumInsight Payer Solutions responds that “Provider-sponsored organizations (PSOs) are not going to change who sees which patients, how they manage/coordinate their care, or what they pay their salaried physicians depending on the type of reimbursement received.   Physicians must move to delivering value regardless of how they are reimbursed.   The historic fee-for-service (FFS) incentives for volume and high-intensity services are already shifting to a blended volume/value system, and this transition will continue to accelerate over time in favor of value.  Many of the leading PSOs are already acutely focused on simultaneously improving patient quality/safety while reducing costs of care, even in their legacy FFS reimbursement relationships. Provider reimbursement will evolve to keep pace with the delivery of clinically integrated, coordinated care – case in point, the growth of value-based reimbursement that is expected to help expedite the transformation of the nation’s healthcare delivery system and make it stick.  But FFS reimbursement by necessity will never totally disappear -- today’s PSOs are showing they can positively transform regardless.”

Douglas A. Hastings, JD , Chair, Board of Directors, Epstein Becker & Green, PC, states in part that  “there is not, nor should there be, any single or simple answer to managing the transition.  The pace of change varies around the country due to historical circumstances, current market activity, and a variety of other variables.  The constants are the need to perform well on evolving consensus quality measures and to contain costs in order to absorb reduced reimbursement in whatever actual form that takes.  In addition, there are affirmative investments necessary to make a successful transition, further underscoring the need for capital and operating cost reductions…..Nevertheless, even the most progressive providers will have a foot in both fee-for-service and value-based payment for a period of time.   Approaches to patient care and financial incentives while different payment methodologies co-exist will vary.   My sense from watching and talking to the most recognized and advanced “Triple Aim”– oriented delivery systems is that they aggressively align treatment protocols and financial incentives within the system toward Triple Aim goals from the outset, even though this approach may cost more in the short run.  They argue that such costs are the price of innovation and doing the right thing and that this approach will pay off in the long run.  I think that they are correct.”

Tom Cassels, Executive Director of Research & Insights, The Advisory Board Company says “disciplined providers aren’t waiting for the conflict created by today’s uncomfortable ‘foot in two boats’ transition to value-based contracting to sort itself out.  Rather they are executing clear strategies to identify areas where investments of time and resources in new care models can yield real near-term returns. For instance, these providers realize that they are already at risk for the total cost of their employee health benefits plans as well as the expense of uncompensated (e.g., uninsured) and under-compensated care (e.g., chronically ill Medicaid patients seeking primary care in the ED).  By following the flow of dollars to areas where reduced spending falls directly to their bottom lines, these organizations are making principled decisions to target segments of the populations they serve where their incentives match the objective of reducing the total cost of care.  This is why some of the most exciting innovation in enhanced primary care, patient navigation, and support for patient self-management is coming out of health systems’ management of their own employees and their dependents.  In the words of one progressive health system CFO, ‘Our own spending shows us where we have the opportunity to create value, and if we can learn to shave on our own face we’ll be more credible to other purchasers as a population health manager in the future.’ ”

Nalini K. Pande, JD, Principal Policy Director, American Institutes for Research  reports that “a recent Commonwealth Fund study has recommended that ACOs align as much of their business as possible with value-based payments.   In fact, providers are currently transitioning to a value-based model that uses incentives to reward value and moving away from the traditional fee-for-service (FFS) model that rewards volume.   How are providers managing this transition?   They have focused on changing their systems and the way they do business.  They are utilizing new care practice models to optimize utilization of services.  This includes predictive modeling to risk stratify a population to identify individual opportunities for intervention.  Providers are also engaging patients in managing their own care and using IT systems to assist with clinical decision support, medical error reduction, and patient safety.  Providers have also adopted new care coordination models with continuous quality improvement and a payment structure that recognizes the added value to patients.  Further, they have set up new infrastructures and systems that allow a shift from quality and efficiency ‘measurement’ to quality and efficiency ‘management’.”

Finally, Peter Boland, PhD, President, Boland Healthcare states in part that “hundreds of organizations are still struggling with variations of the ‘what do we want to be when we grow up’ syndrome. The realists understand that bearing increasing levels of financial risk (and reward) with payers and purchasers is becoming the norm. The straddlers still cling to fee for service and volume-based reimbursement despite the inability of Medicare and employers to support such payment. Many providers have recently taken the plunge into the ‘brave new world’ of Medicare Shared Savings Program with an eye towards a gradual transition to modest risk and gain sharing over a five-year period. ….It is an illusion to think that health delivery organizations can have it both ways.  The industry is at the tipping point where accountability for price and service (the value equation) is ‘the new normal’. Good medicine dictates that patients not be stratified by type of payment.  Good business requires meaningful performance metrics to be agreed upon – and tracked -- as the basis for compensation.”

Accountable Care News includes the Thought Leaders panel answering a timely question of the month in each issue, in addition to several feature stories, industry news briefs, and a profile interview with a prominent person involved with accountable care. You can check it out at www.accoutnablecarenews.com.

Saturday
Aug252012

The Los Angeles Times Reports on The Most Litigious Doctor

Clive Riddle, August 24, 2012

The Los Angeles Times recently ran a feature story, State suing doctor over billing tactics regarding “Jeannette Martello's aggressive tactics to collect fees from emergency room patients — including lawsuits and taking out liens on their homes — prompt unprecedented court case by state officials. “

The article notes that “the state's lawsuit against Martello, however, is the first of its kind, according to Marta Green, California Department of Managed Health Care spokeswoman. State officials allege in court papers that Martello collected or attempted to collect more from patients than insurance companies paid, a practice known as balance billing.”

The story about Doctor Martello’s very unique, aggressive tactics to pursue balance bills for contracted patients first broke months ago in MCOL affiliated Payers & Providers.  The Payers & Providers weekly California Edition reported on her activities, and then released a twelve page white paper,  The Many Stories Of One Highly Litigious Physician, with the sub-heading: “Surgeon Treats Patients at Southern California ERs – Then Sues Them” that details account of her 46 small claims and 23 superior court claims filed against her ER patients during the past several years, and the impact upon a number of the patients and their families.

The Times article cites Payers & Providers Publisher Ron Shinkman: “Ron Shinkman, who wrote about Martello and her tactics in the trade publication Payers & Providers, said he had never seen a more litigious doctor in 19 years of healthcare reporting.”

Thursday
Aug162012

Not So Bad to Be Employed in Healthcare in this Economy

By Clive Riddle, August 17, 2012

Randstad Healthcare, one of the nation’s largest healthcare staffing firms, now maintains a “Healthcare Employee Confidence Index, a measure of overall confidence among U.S. healthcare workers” which they state “declined 4.5 points to 53.9 in the second quarter of 2012” according to the Harris Interactive quarterly survey they commissioned.

The company states “the quarterly survey of 232 workers currently employed in the healthcare industry, which included physicians, healthcare administrators, as well as other healthcare professionals, reflects a sizeable increase in those who believe the economy is getting weaker. At the same time, that sentiment did not damper workers' personal confidence, as more stated that they believe more jobs are available and they are likely to look for one in the next 12 months. “

Steve McMahan, an  executive vice president with Randstad tells us "understandably, healthcare workers are concerned about the overall economy, but at the same time, this does not seem to be hampering their personal confidence in their own abilities and attractiveness to other potential employers. In fact, when it comes to their own employability, half of healthcare workers surveyed still remain confident that they could find alternative employment if they chose to.”

Here’s some of their survey findings:

  • 43% believe the strength of the economy is weakening, an increase from 27% in first quarter 2012
  • 20% of healthcare workers believe the economy is strengthening.
  • 24% report that more jobs are available, but 49% of healthcare workers believe there are fewer opportunities available
  • 51% indicate that they are confident they could find a job (versus 58%in Q1 2012)
  • 58% of healthcare workers feel confident in the future of their company
  • 37% of healthcare workers are likely to look for a new job in the next 12 months (rising six percentage points from Q1 2012)

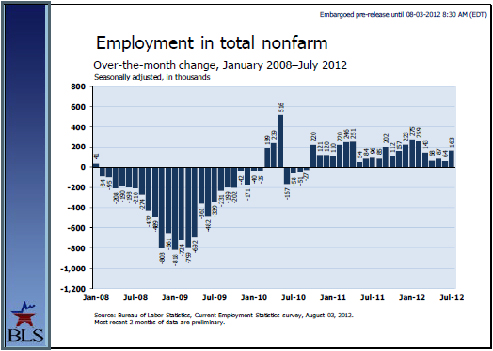
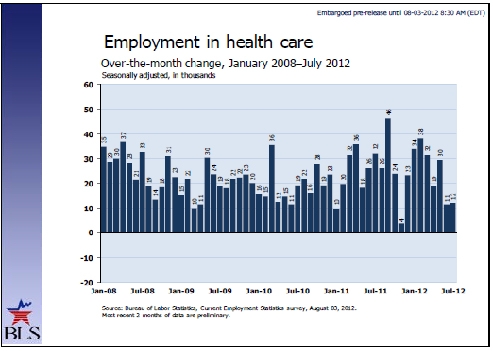
It’s interesting of course, to contrast the US healthcare employment picture from the economy as a whole, since the onset of the Great Recession. Here’s Bureau of Labor Statistics graphics from their Current Employment Statistics Highlights, July 2012 issued on August 3rd.

Maybe its not so bad to be employed in healthcare.

Friday
Aug102012

Aon Hewitt Finds Employee Wellness Incentives Continue to Proliferate, Tie Rewards to Results

By Clive Riddle, August 10, 2012

Aon Hewitt, based on findings from their 2012 Health Care Survey of 1,800 employer organizations that represent over 20 million employees, tells us that “employers are increasingly relying on incentives to drive participation in health programs and encouraging employees and their families to take better care of themselves.”

Here’s data Aon Hewitt shared regarding the state of employers and incentives in 2012:

  • 84% offer incentives for participating in a health risk assessment
  • 64% offer an incentive for participation in biometric screening
  • 51% offer incentives to participants in health improvement and wellness programs
  • 59% used monetary incentives to promote participation in wellness and health improvement programs, up from 37% in 2011
  • Monetary incentives for participating in disease/condition management programs increased from 17% in 2011 to 54% in 2012
  • 46% incorporate some type of VBID (Value Based Insurance Design)
  • Less than 10% provide an incentive to address the results of the health risk assessments or take action based on  biometric screening results
  • 58% of employers that offer incentives,  provide incentives for completing lifestyle modification programs
  • About one-fourth of employers that offer incentives, provide incentives for progress or attainment made towards meeting acceptable ranges for biometric measures

Jim Winkler, Aon Hewitt’s  chief innovation officer for Health & Benefits reaches this conclusion: "Incentives solely tied to participation tend to become entitlement programs, with employees expecting to be rewarded without any sense of accountability for better health. To truly impact employee behavior change, more and more organizations realize they need to closely tie rewards to outcomes and better results rather than just enrollment."

Friday
Jul272012

ACOs by the numbers

By Clive Riddle, July 27, 2012

CMS now touts that with the 88 ACOs brought on line effective July 1, 2012. “the total number of organizations participating in Medicare shared savings initiatives to 153, including the 32 ACOs participating in the testing of the Pioneer ACO Model by the Center for Medicare and Medicaid Innovation (Innovation Center) that were announced last December, and six Physician Group Practice Transition Demonstration organizations that started in January 2011.  In all, as of July 1, more than 2.4 million beneficiaries are receiving care from providers participating in Medicare shared savings initiatives.”

On the commercial side, Cigna has been a national leader in the ACO arms race, with Aetna also making waves, and a wide range of plans have well-developed regional initiatives. Cigna states they are now engaged in 38 patient-centered initiatives in 19 states, including six multi-payer pilots and 32 Cigna-only collaborative accountable care initiatives, covering more than 300,000 Cigna customers, with more than 4,500 participating primary care physicians. Aetna Inc. is developing commercial ACO and Aetna currently has 10 commercial ACO agreements in place and hopes to 20 by the end of the year.

Perhaps the most prevalent commercial strides with attributed membership to date involve the self-funded employee populations of the hospitals and physician organizations that have developed ACOs, using their own employees as the initial pilots for their respective programs.

Using MCOL research in compiling Version 2 of the Accountable Care Directory 2012, the following are ten identified ACOs with large attributed membership (combining Medicare and Commercial when applicable) at this juncture:

  1. Advocate Health Partners, serving Illinois with 350,000 attributed members
  2. Partners for Kids, serving 37-county coverage area, stretching from urban Columbus to rural Appalachia with 290,000 attributed members
  3. Healthcare Partners Medical Group, serving Los Angeles and Orange Counties, CA with 89,000 attributed members
  4. Accountable Care Coalition of Texas, Inc. , serving Houston/Beaumont area, Texas with 70,000 attributed members
  5. Heritage Provider Network, serving Southern, Central, and Costal California with 70,000 attributed members
  6. Aurora Accountable Care Network, serving Eastern Wisconsin and Northern Illinois with 58,000 attributed members
  7. Sharp Healthcare ACO, serving San Diego County, California with 56,700 attributed members
  8. Atlantic Accountable Care Organization, serving Bergen, Morris, Somerset, Sussex, and Union counties, New Jersey with 50,000 attributed members
  9. Hill Physicians Medical Group, serving Sacramento, El Dorado, Placer counties, California' with 46,000 attributed members
  10. Partners Healthcare, serving Eastern Massachusetts with 45,000 attributed members
Friday
Jul202012

The Role of Pharmaceuticals in Value-Based Healthcare

by Clive Riddle, July 19, 2012

Who is the “Working Group on Optimizing Medication Therapy in Value-Based Healthcare” you ask? They consist of National Pharmaceutical Council (NPC), the American Medical Group Association (AMGA) and the Premier health care alliance, along with seven provider organizations, formed to develop a “framework for considering the role of pharmaceuticals in achieving value-based success.”

It could seem somewhat self-serving, given the National Pharmaceutical Council was a driving force in the initiative and issued the press release about their newly published framework. However the group does say some interesting things. Their entire thoughts on the matter are published in a web article,  Role of Pharmaceuticals in Value-Based Healthcare: A Framework for Success, in the American Journal of Managed Care.

NPC Chief Science Officer Robert Dubois, MD, PhD tell us “Providers are shifting to value-based care models to provide better care for individuals, improve population health and slow cost growth. Many of these models, such as the Centers for Medicare & Medicaid Services' Medicare Shared Savings Program, include quality benchmarks and incentives for reducing costs. As providers evaluate optimal care for their patient populations in these new models, prescription medications should be thoughtfully integrated into the process.”

Here’s the components of the framework they have constructed:

  1.  Success in a value-based environment will depend on understanding the unique contribution of medications and utilizing them optimally across conditions and populations.
  2. Medications cannot be viewed as a siloed expense item in a value-based environment. They need to be integrated so that the cost offsets and quality benefits resulting from optimized pharmaceutical use can be recognized and calculated.
  3. Services meant to optimize patient outcomes cannot be undertaken as a one-size-fits-all approach; the role, impact and characteristics of these services will vary by a patient's condition.
  4. Overall risk factors can be used to identify patients who are candidates for medication therapy management strategies to watch for drug-drug, drug-disease, or polypharmacy concerns.
  5. In each circumstance where there are condition-specific incentives to achieve cost savings, there should also be a quality metric to detect under-use of pharmaceuticals.

The group views ACOs as a centerpiece of value based programs. Doctor Dubois leaves us with this thought: "It is crucial for ACOs to view prescription drugs as a tool, not simply an expense.”

Thursday
Jul122012

The Emerging Pharmaceutical Pendulum

By Clive Riddle, July 12, 2012

Conventional wisdom tells us that pharmaceutical growth is not the beast it once was. Growth has decelerated and been tamed to the point of 3-4 percent this year, due to a variety of factors including the lingering economic downturn, patent expirations with the corresponding conversion to generics, and a dip in patient demand due to increased cost sharing requirements and coverage concerns.

The IMS Institute for Healthcare Informatics now tells us the pendulum is poised to swing back the other way, and they are forecasting 5-7 percent growth in 2016. However, this resurgence is significantly projected to be driven by emerging versus developed markets.

Their just released report: The Global Use of Medicines: Outlook through 2016, “found that annual global spending on medicines will rise from $956 billion in 2011 to nearly $1.2 trillion in 2016, representing a compound annual growth rate of 3-6 percent. Growth in annual global spending is forecast to more than double by 2016 to as much as $70 billion, up from a $30 billion pace this year, driven by volume increases in the pharmerging markets and an uptick in spending in developed nations.”

Murray Aitken, the Executive Director of the IMS Institute for Healthcare Informatics tells us, “as health systems around the world grapple with macroeconomic pressures and the demand for expanded access and improved outcomes, medicines will play an even more vital role in patient care over the next five years. The trillion-dollar spending on medicines we forecast for 2016 represents a rebound in growth that will accentuate the challenges of access and affordability facing those who consume and pay for healthcare around the world.”

Their report also projects that around the globe:

  • Spending on medicines in developed nations will increase by a total of $60-70 billion from 2011 to 2016, following an increase of $104 billion between 2006 and 2011.
  • Spending in the U.S. will grow by $35-45 billion over the next five years, representing an average annual growth rate of 1-4 percent
  • In Europe, growth will be in the -1 to 2 percent range due to significant austerity programs and healthcare cost-containment initiatives.
  • The Japanese market for medicines is forecast to grow 1-4 percent annually through 2016, slightly lower than the rate during the prior five years and reflecting biennial price cuts scheduled for 2012, 2014 and 2016.
  • Overall, patent expiries in developed markets will yield a five-year “patent dividend” of $106 billion, reflecting reduced brand spending of $127 billion offset by $21 billion in higher generics spending
  • Annual spending on medicines in the pharmerging markets will increase from $194 billion last year to $345-375 billion by 2016, or $91 in drug spending per capita. Generics and other products, including over-the-counter medicines, diagnostics and non-therapeutics, will account for approximately 83 percent of the increase.
  • Pharma manufacturers will see minimal growth in their branded products through 2016. The market for branded medicines will experience flat to 3 percent annual growth through 2016 to $615-645 billion, up from $596 billion in 2011.
  • In the major developed markets, branded medicine growth will be severely constrained at only $10 billion over the five-year period due to patent expiries, increased cost-containment actions by payers and modest spending on newly launched products.
  • The pharmerging markets are expected to contribute $25-30 billion in branded product growth over the same period. Off-invoice discounts and rebates will offset about $5 billion of global branded medicine growth.
  • Global generic spending is expected to increase from $242 billion in 2011 to $400-430 billion by 2016, fueled by volume growth in pharmerging markets and the ongoing transition to generics in developed nations.
  • Global launches for New Molecular Entities (NMEs) will rebound during the next five years, as 32-37 NMEs are expected to be launched per year through 2016. Between 2011-16, 160-185 NMEs are expected to launch, compared with 142 between 2007-11.
  • Biologics are expected to account for about 17 percent of total global spending on medicines by 2016, as important clinical advances continue to emerge from research.
Thursday
Jun212012

The Digital Health Self-Service Counter

By Clive Riddle, June 21, 2012

So you’ve navigated the self-service checkout counter, purchasing your toilet repair kit and halogen light bulbs at your big-box hardware store; and even braved the self-service experience with your greek yogurt, arugula and asiago cheese at your grocery store. Now are you ready to do the same with your healthcare?

Accenture says you are indeed, to a point, if you can just find the checkout counter.  They have just released results of the Accenture Connected Health Pulse Survey , based on an online survey of 1,110 U.S. patients to determine the preferred channels of electronic health information and services. They found that “the vast majority of patients (90 percent) want to self-manage their healthcare leveraging technology, such as accessing medical information, refilling prescriptions and booking appointments online, but nearly half (46 percent) are unaware if their health records are available electronically.”

What’s more, as Accenture’s Kaveh Safavi, MD, JD, tells us, “patients increasingly want access to their personal medical information, anytime, anywhere. But they’re not willing to give up the option of face time with their physicians.” (85% surveyed want to be able to communicate with their doctor in person.)  So just like the grocery and hardware stores that must still provide full-service counters next to their self-checkout lines, consumers want their in-person doctors and nurses and mhealth too. Although, as an aside, who are these 15% of consumers that don’t want to be able to communicate with their doctor in person?

Here’s more consumer findings from Accenture’s survey:

  • 83 % want online access to their health records
  • 48 % want their doctors to manage their medical records, while 44 % prefer to manage their own
  • 33 % did not know whether services such as bill pay, electronic reminders and lab results were available to them online
  • 72 % want to book, change or cancel physician appointments through via  website; 68% would like to do so via a mobile device (meaning most want both)
  • 88 % want to receive email reminders for preventative or follow-up care;  63% would like to receive these reminders via their mobile phone (meaning most want both)
  • 76 % want the option of email consultations with doctors, 74% would like telephone consultations, including via mobile phone (meaning most want both)
  • 73 % would like to use a mobile device for requesting prescription refills; 72% want to be able to use a website to do so (meaning most want both)

For more about the role of in person vs. self-service healthcare, you can check out the mHimss blog by David Lee Scher, MD in which he offers 5 reasons why mobile health apps will never replace doctors. If you just want to read the cliff notes version, we’ve summarized his list in healthsprocket.

Thursday
Jun142012

What to Do Whilst Waiting for SCOTUS

By Clive Riddle, June 14, 2012

At times it may feel like the pending Supreme Court decision regarding the Affordable Care Act may play out like Waiting for Godot, but exercise some patience for The Decision on The Act that hopes to encourage exercise for patients, among a bazillion other things. Decision-Day will come soon enough. Too soon, for some stakeholders on one side of the fence or the other, undoubtedly.

While you’re waiting, it’s interesting, although not entirely instructive, to review the past SCOTUS cases involving various aspects of health care and health insurance law. FindLaw provides a summary of these cases, with links to each case.  A quick listing of these 15 cases is available in a healthsprocket list: Historical Supreme Court Health Law Related Cases. This accumulation of cases will be bookended by Roe v Wade in 1974, and the pending 2012 Affordable Care Act decision. In between are less-distinguished cases all being decided upon during the first decade of this century. These other cases include:  two involving health plans (Aetna and United’s PacifiCare) stemming from the managed care backlash era; three abortion related cases (in addition to Roe v Wade); two Medicaid cases (regarding provider payments and eligibility);  prescription solicitation; medical device safety claims; employer liability for mental anguish due to potential future work-related health claims; due process involving mental illness; punishment of mentally disabled criminals; physician-assisted suicide; and medical marijuana.  

You can consider the private marketplace response, back when implementation of the Act was still pending, and now when The Decision is pending. Back in the spring of 2010, “early adopter” health plans extended coverage provisions well before their required effective date. Now that the entire Act may be in jeopardy, “post-adopter” health plans have indicated they will continue to provide a number of coverage provisions in the event the Act is overturned.

You can also produce your own History Channel version of when we went through all of this before, and review the literature on the public and stakeholder controversy surrounding adoption of Medicare into law in 1965. Déjà vu – perhaps everything old is new again? One might wonder if and how the current SCOTUS might have weighed in on that.

Or you could read through a litany of papers on the implications, permutations, considerations and expectations for The Decision. RAND just released a good study on How Would Eliminating the Individual Mandate Affect Health Coverage and Premium Costs? Here’s some recent typical articles: Employers' 'plan B' if health reform is axed (CNNMoney, June 14, 2012); Health spending likely to keep rising with or without Obama's plan (Los Angeles Times, June 13, 2012); Undoing health law could have messy ripple effects (Associated Press, June 11, 2012)

Still don’t’ know what to do with idle time while impatiently waiting for SCOTUS? You can always use this healthsprocket list, offering five things you can do while waiting for the Supreme Court Affordable Care Act decision.

Friday
Jun082012

PPSA: What will come of the Physician Payments Sunshine Act?

by Clive Riddle, June 8, 2012

One of the oodles of components of the Affordable Care Act is the Physician Payments Sunshine Act, which, according to the CMS proposed rule issued 12/19/11 “would require applicable manufacturers of drugs, devices, biologicals, or medical supplies covered by Medicare, Medicaid or the Children’s Health Insurance Program (CHIP) to report annually to the Secretary [of Health and Human Services] certain payments or transfers of value provided to physicians or teaching hospitals (‘covered recipients’). In addition, applicable manufacturers and applicable group purchasing organizations (GPOs) are required to report annually certain physician ownership or investment interests.”

Of course stakeholders and studies have come out on both sides. Various physician and pharmaceutical interest groups have invested in arguing the administration costs and burdens to be borne outweigh the potential benefits. The Archives of Internal Medicine published a Research Letter last week: Effect of Physician Payment Disclosure Laws on Prescribing describing results of study of two such state laws that did not produce intended results. Consumer interest groups have placed count-pressure to fully implement the Act, such as the Pew Prescription Project.

Perhaps in response to such conflicting pressures and 300 comments received to date, CMS last month blogged that they were delaying issuance of the Final Rule until later this year, and provided assurance that no data collection would be required before January 1, 2013.

In the midst of all this, Deloitte has just released a 28 page report: Physician Payment Sunshine Act: Physicians and life sciences companies coming to terms with transparency? The report is based on a survey conducted by Forbes Insights for Deloitte, was conducted in January and February 2012 among 110 U.S.-based physicians and 223 global executives from life sciences companies worldwide. Their findings would seem to indicate we’ll all get through this somehow.

The survey indicated that, when posed the question “Are you in favor of a public, searchable database of all physician-industry relationships to be available to the public?” 54% of physicians responded “yes, as long as patients understand how to interpret the data” and another 14% went further, stating “yes, the more information patients can get, the better.”

Deloitte reported that “with about 12 months to go until the first reporting requirements under PPSA (March 2013), two-thirds (66 percent) of the life sciences executives responding ...said that their companies are either “100 percent ready” or are “50 percent done and hoping to be ready in time” for the PPSA and other new compliance requirements. Meanwhile, the majority (55 percent) of life sciences companies expect to see their HCP transparency-related compliance investments to continue to increase in 2012 and 2013. Almost half (48 percent) of these investments are expected to go into in-house training programs, 34 percent to in-house software upgrades and integration, and 25 percent to hiring new full-time employees.”

But will these new requirement ultimately achieve positive objectives? Seth Whitelaw, Director, Deloitte & Touche LLP U.S., tells us “as the survey results illustrate, physicians, the life sciences industry, and even governments are expected to expend significant time, effort, and resources complying with PPSA. Yet it is too early to tell whether the PPSA will significantly alter the landscape of provider-industry relationships.”

Deloitte cautions that “almost three-quarters (72 percent) of physicians responding to the survey believe that new regulations will not change provider-industry relationships. Moreover, despite all the efforts to comply with the new regulations, 38 percent of life sciences executives responding to the survey said that they either don’t know how, or have no plans, to use and leverage the publicly available data regarding other companies.”

Friday
May182012

Contracting Web Summit e-Poll Results

By Clive Riddle, May 18, 2012

Survey results are now available from the Contracting e-poll held in conjunction with HealthcareWebSummit’s 2012 Contracting Web Summit, which provide a measure of stakeholder contracting views and priorities, with comparisons to previous year’s answers.

Participants were asked to respond to three items:

1.  Please categorize your organization. Purchaser; Provider; or Vendor/Other

2.  What are the greatest opportunities from a contracting perspective?

3.  What are the greatest challenges from a contracting perspective?

Responses to Greatest Opportunity by Year:

  • Advancements in analytics capabilities: 18.5% (2012); 19.4% (2011); 7.5% (2010)
  • Advancements in EHRs & transactions: 7.4% (2012); 10.2% (2011); 16.7% (2010)
  • Consumer engagement initiatives: 7.4% (2012); 12.0% (2011); 10.8% (2010)
  • Emergence of value based/newer payment models: 29.6% (2012); 29.6% (2011); 26.7% (2010)
  • Formation of ACOs: 8.6% (2012); 7.4% (2011); 16.7% (2010)
  • Increased covered population due to health reform: 18.5% (2012); 13.9% (2011); 17.5% (2010)
  • Potential growth in medical homes: 7.4% (2012); 3.7% (2011); 0.8% (2010)
  • Other: 2.5% (2012); 3.7% (2011); 3.3% (2010)

Responses to Greatest Challenge by Year:

  • Consumer engagement Initiatives: 8.6% (2012); 6.5% (2011); 9.9% (2010)
  • Continued market consolidation: 13.6% (2012); 7.4% (2011); 14.1% (2010)
  • Cost pressures due to economic downturn: 21.0% (2012); 33.3% (2011); 28.1% (2010)
  • ICD-10 transition: 7.4% (2012); 0.9% (2011); 6.6% (2010)
  • Increased complexities of benefit design: 12.3% (2012); 11.1% (2011); 8.3% (2010)
  • Increased mix of government vs. commercial covered populations: 14.8% (2012); 16.7% (2011); 14.9% (2010)
  • Issues related to health reform provisions: 17.3% (2012); 15.7% (2011); 14.1% (2010)
  • Other: 4.9% (2012); 8.3% (2011): 4.1% (2010)

For the third year in a row, a plurality of respondents thought that the emergence of value based and other applicable newer payment models was the greatest opportunity from a contracting perspective, with 29.6% of respondents answering this way. In 2011, the same percent of respondents agreed that this was the greatest opportunity which was three percentage points greater than in 2010.

The next most prevalent answers to what was the greatest opportunity were advancements in analytics capabilities and increased covered population due to health reform. For both of these options, 18.5% of respondents answered this way. These responses had been the second and third most prevalent answers in 2011 as well, however, advancements in analytics capabilities was chosen by 19.4% of respondents and increased covered populations due to health reform was chosen by 13.9%.

The remaining answers to what were the greatest opportunities from a contracting perspective (not including other which was chosen by 2.5% of respondents) were chosen by a similar percent of respondents, all of which were within one percentage point of 8%.

When broken down by respondent category there were some variations. While those who categorized their organizations as purchaser or vendors/others followed the overall trend of designating the emergence of value based and other applicable newer payment models as the greatest opportunity from a contracting perspective, providers were split on what the greatest opportunity was between the emergence of value based payment models and increased covered population due to health reform both of which garnered 25% of respondents in that category.

The biggest variation among respondent category was on the response to whether advancements in analytics capabilities was the greatest opportunity from a contracting perspective. Overall, 18% of respondents thought that this was the greatest opportunity. Purchasers were the most likely to answer this way with 30.4% of those respondents choosing this as the greatest opportunity. Respondents categorizing themselves as vendor/other were the least likely to respond this way with only 7.1% believing it as the greatest opportunity.

Just as with the greatest opportunity, the respondent’s choice for the greatest challenge carried over a three year trend with a plurality of respondents signaling that cost pressures due to economic downturn was the greatest challenge with 21% of respondents answering this way. This was a much smaller plurality than in previous years and was only 3.7 percentage points greater than the next most common answer for what the greatest challenge was; issues related to new health reform provisions.

The rest of the options for what the greatest challenges are from a contracting perspective are (excluding other) all fell within ten percentage points of each other. 8.6% of respondents chose consumer engagement Initiatives, 13.6% chose continued market consolidation, 7.4% chose ICD-10 transition, 12.3% chose increased complexities of benefit design, and 14.8% chose increased mix of government program vs. commercial covered populations as the greatest challenge.

Looking at responses year over year, most answers ticked slightly up in 2012 compared with 2011 and 2010 with two exceptions; cost pressures due to economic downturn, which dropped 12.3 percentage points from 2011, and increased mix of government program vs. commercial covered populations, which dropped almost 2 percentage points from 2011.

Thursday
May102012

Guy D'Andrea on Pitfalls and Practical Solutions with Shared Savings

By Clive Riddle, May 10, 2012

Guy D’ Andrea, Managing Partner at Discern Consulting, was one of the featured speakers in this week’s Contracting Web Summit 2012, and spoke on  Shared Savings: Pitfalls and Practical Solutions.

For those who need a refresher in what Shared Savings are all about, Guy summarized these core concepts:

  • Retrospective calculation of provider’s cost savings (usually relative to overall trend) for a defined population
  • Provider is eligible to receive some percentage of the savings as an incentive payment
  • Usually (but not always) a “one-way” risk arrangement
  • Can include some prospective, fixed payment (essentially a pre-payment for expected savings)

Shared Savings, of course, are a centerpiece of accountable care and medical home initiatives. But stakeholders do run into pitfalls as they try to come to agreement, and implement such arrangements. Before moving on to discuss building a payment model for shared savings with readmissions, Mr. D’Andrea discussed these pitfalls and some general potential solutions.

The prospective payment is a sticking payment. Guy notes that providers will always want the maximum possible prospective payment, since it is “risk-free” revenue.  Payers will want to delay payments until savings are achieved.” His solution: “treat prospective payments as an investment, and discount expected savings to present value.”

Then the argument comes up that is more difficult for high-performing providers to generate savings, because they tend to get penalized for having already done well, leaving less room for future improvements. His solution: “use a ‘blended’ model, in which the target budget is set using a combination of the provider’s own cost history, and that of the peer group.”

Next  comes the concern that  a provider’s experience, particularly when the population isn’t large enough to adequately spread the risk, will be influenced more by luck with outliers than factors under the provider’s control. The D’Abdrea solutions: (1) Establish minimum population sizes and savings rates;  (2) Tie payments to performance on clinical process measures; and (3) Exclude “random, rare, and expensive” events from cost of care calculations.

Lastly,  he addresses the concern of sustainability: he notes that “if savings are a “one-time” event, providers may be worse off financially in the long-run than if they saved nothing (especially for integrated systems).” His solutions: (A) Use a multi-year model that partially credits providers with savings in earlier years; and (B) In the long-term, seek to evolve from shared savings to “two-tailed risk” payment models, such as bundled payment or global capitation.