Search

Entries in Surveys & Reports (184)

Monday
Feb252019

Stakeholders Pick Rx Costs & Pricing as Topic With Greatest Impact This Year

Clive Riddle. February 25, 2019 

MCOL and Healthcare Web Summit jointly sponsored a survey of healthcare professionals on which of three key topics would have the greatest impact, and what stakeholders would be economic winners and losers during this year. Here’s a summary of the findings: 

Participants were asked to respond to three items:

 1.  Which one of these three topics will have the greatest impact on stakeholders in 2019? 

  • Medicaid Funding and Eligibility
  • Pharmaceutical Costs and Pricing
  • Value Based Care Initiatives  

2. Please project who you think the economic winners and losers for 2019 will be. Who do you think will be economically better off, the same or worse off by this time next year: Consumers; Employers; Health Plans; Hospitals; Physicians; Pharmaceutical 

3. Please indicate your perspective 

  • Purchaser (Health Plan, Employer, TPA, Agent, PBM)
  • Provider (Hospital, Physician, Pharmaceutical, Other Providers)
  • Vendor or Other  

Stakeholders overall (51.7%) selected Pharmaceutical Costs and Pricing as the topic having the greatest impact in 2019, compared to Value Based Care Initiatives (31.7%) and Medicaid Funding and Eligibility (16.7%). 

Providers (54.5% and Vendor/Other (52.0%) respondents both selected Rx as the top choice, but Purchasers selected Value Based Care (53.8%) slightly over Rx (46.2%).  More Providers selected Medicaid (27.3%) over Value Based care (27.3%), while Vendors chose Value Based Care (32.0%) over Medicaid (16.0%)

More respondents (45.2%) overall selected Pharmaceutical Stakeholders vs. other categories as being better off in 2019  Health Plans came in second for being better off at 33.9%. Hospitals reflected the least optimism, with just 18.0% viewing them as better off this year. 

Hospitals thus were viewed with the most pessimistic outlook, with 65.2% feeling they will be worse off this year. Physicians were next in line, at 56.5%.Health Plans and Pharmaceutical stakeholders tied for the least pessimism, each with 21.7% viewing them as worse off this year. 

It should be noted that these levels of pessimism have generally declined from last year. The top three choices for being worse off in last year’s epoll all dropped: Consumers from 68.&% in 2018 to 38.7% in 2019; Hospitals from 57.2% in 2018 to 49.2% in 2019; and Physicians from 50.8% in 2018 to 29.0% in 2019. 

Purchasers had a rosier view for Consumers and Pharmaceutical stakeholders, with 46.2% saying Consumers would be better off, compared to 23.7% of Providers and 23.1% of Vendors/Others; and 61.5% of Purchasers saying Pharmaceutical would be better off compared to 39.1% of providers and 42.3% of Vendors/Others. 

Providers saw themselves in a worse position for 2019 compared to other respondents. 65.2% of Providers said Hospitals would be worse off, compared to 38.5% of Purchasers and40.0% of Vendors/Others. 56.5% of Providers said Physicians would be worse off, compared to 30.8% of Purchasers and 34.0% of Vendors/Others.

Friday
Feb152019

Speaking Tooth to Power: J.D. Power Releases Dental Plan Satisfaction Report

By Clive Riddle, February 15, 2019 

J.D. Power has released their annual Dental Plan Satisfaction Report for 2018, which finds that “overall dental plan customer satisfaction has improved by 5 points (on a 1,000-point scale) to 775 from 2017.”  

J.D. Power reports that “DentaQuest (805) ranks highest, performing particularly well in the customer service, communication, and cost factors. HumanaDental (784) ranks second and myCignaDental (782) ranks third.” 

And just who is DentaQuest, who has now been ranked first for the third year in a row? They tout that they “manage dental and vision benefits for more than 27 million Americans and provide direct care to patients through our network of more than 85 oral health centers in five states,” and that they provide “dental solutions for Medicaid and CHIP, Medicare Advantage, small and large businesses and individuals throughout the U.S.” 

Steve Pollock, president and chief executive officer of DentaQuest.  Pollock says the company’s continued investment in technology and person-centered care solutions as reasons for the high customer satisfaction. “While it is incredibly gratifying to see the high satisfaction among our members, we know that true success means ensuring everyone has access to quality oral health care,” Pollock said. “Our Preventistry™ platform, which is a prevention-based approach that defines oral health as more than visits to the dentist, will ultimately improve oral health for all.”

Friday
Jan182019

Peering Into the Perpetual State of Crisis in Healthcare?

by Clive Riddle, January 18, 2019 

This week, Gallup released data from their annual healthcare poll, which found “Seventy percent of Americans describe the current U.S. healthcare system as being "in a state of crisis" or having "major problems." This is consistent with the 65% to 73% range for this figure in all but one poll since Gallup first asked the question in 1994.” The point out the only time the figure dipped was in 2001, just after the September 11th attacks, when terrorism was top of mind, and “just” 49% of the public felt U.S. healthcare was in crisis or having major problems. 

The first year Gallup took the poll – in 1994, 69% held we were crisis bound, and 30% said we were just experiencing minor problems. At the end of 2018, the number virtually hasn’t shifted: 70% crisis and 30% minor problems. 

But while U.S. healthcare may have been besot in a crisis-soaked state of affairs during the past decades, it appears that crisis, like beauty, is in the eye of the beholder and the beholder’s lens is shaped by politics.

Democrats were in the 70-84% crisis range in the post 9/11 Bush years. Upon Obama’s election, the Democrat crisis levels dropped  (from 84% to 59% from 2007-2014) and the Republican levels rose (from 58% in 2007 to 80% in 2016); meeting at similar levels as the ACA passed and early implementation rolled out.  Then with Trump, Democrats soared from 63% to 84% while Republicans plummeted from 80% to 56%. 

The prediction for public perception of healthcare crisis entering the next decade and another presidential election year? Perpetual, and Political.

Friday
Jan112019

Two New Milliman White Papers On MSSP Pathways to Success: 

Final Rule Revisions and Data Mining Tactics to Reduce Population Costs

By  Clive Riddle, January 11, 2019

Milliman's Noah Champagne, Charlie Mills, and Jason Karcher published a white paper on January 7th: “Pathways to Success” MSSP final rule: Key revisions to the proposed rule, which was preceded with a paper on January 4th by Kathryn V. Fitch, Adam Laurin, and Michele M. Berrios: “Pathways to Success” MSSP final rule: Faster movement to downside risk increases focus on reducing population costs.

The final rule isn’t a radical departure from the proposed rule, but as Champagne, Mills and Karcher summarize, these are the key changes from the proposed rule:

  • Levels A and B maximum shared savings percentage increased from 25% to 40% while Levels C and D increased from 30% and 40%, respectively, to 50%.
  • Less strict definition of low-revenue ACO: Now ACOs are considered “low revenue" if their historical Medicare Part A and B fee-for-service (FFS) revenues are less than 35% of the total historical expenditures for their assigned Medicare beneficiaries. 
  • High-revenue ACOs currently participating in MSSP Track 1+ will be allowed an exception to renew for one agreement period in Level E of the BASIC track.
  • New, low-revenue ACOs, not experienced with performance-based Medicare ACO initiatives, will be allowed to remain in Level B (one-sided risk) for an additional performance year. 
  • The final rule retains the proposed 3% cap on benchmark increases for risk scores. However, ACOs’ benchmarks will be fully adjusted for changes in the relative risk score when there is a decrease from the baseline year to the performance year instead of applying a 3% reduction cap as originally proposed.
  • The final rule still uses a maximum regional cost blending percentage of 50%, but finalizes a more gradual phase-in of the maximum blending percentage from the proposed rule for ACOs with historical expenditures above their regional service areas.
  • ACOs participating in the July to December 2019 performance period and selecting prospective assignment will be assigned beneficiaries based on October 2017 to September 2018 experience data.

Champagne, Mills and Karcher conclude that “CMS introduced the MSSP with the goal of transitioning ACOs to becoming risk-bearing entities and improving the quality of care provided to Medicare FFS beneficiaries. With the MSSP final rule, CMS has reaffirmed its commitment to these goals while offering greater shared savings potential to ACOs participating in the BASIC track and making the BASIC track available to a broader set of ACOs. The effect of these rule changes on specific ACOs will vary significantly depending on an ACO’s size, region, cost and quality performance, and structure.”


Fitch, Laurin and Berrios remind us that “one of the hallmarks of the new MSSP rule is faster movement to downside risk. Under the current regulations, accountable care organizations (ACOs) can stay in an upside-only track for up to six years. The new rule requires some ACOs in the Basic Track to begin assuming some downside risk in year 3.”  They stat that “under the new rule, there will be a more urgent need for ACOs to reduce population costs,” and that “two major tactics are typically implemented by health plans and ACOs to reduce population costs” are demand management and supply management.


Their report “focuses on supply management and, in particular, data mining tactics that identify medically unnecessary services.” They advocate "several data mining tactics we have seen successful ACOs adopt to effectively guide strategies to reduce medically unnecessary services and in turn reduce the ACO’s total population costs." including:

  • "For MSSP participants, the monthly Claim and Claim Line Feed (CCLF) data files provided by CMS should be routinely grouped and summarized into an actuarial cost model in order to evaluate cost drivers, identify potential targets for utilization reduction initiatives, track outcomes expected from key initiatives, and track overall costs compared to the ACO’s PMPY expenditure benchmark set by CMS."
  • "After identifying potential services to target from the actuarial cost model, organizations need to evaluate whether the utilization and spend in a service category represents efficient or inefficient care with very little or very large opportunity for improvement."
  • "ACOs must be able to target inefficient physician performance, which requires credible provider profiling. As with the benchmarking exercise described previously, physician profiling requires credible risk adjustment."
  • "ACO should also consider data mining to identify leakage of services to providers outside of the ACO." 
Friday
Dec072018

Premium and Deductible Cost Sharing: A Dozen Key Findings from the Commonwealth Fund

by Clive Riddle, December 7, 2018 

CMS has just touted the National Health Expenditure growth of 3.9% for 2017 is at historic low levels, with the Office of the Actuary stating “prior to the coverage expansions and temporary high growth in prescription drug spending during that same period, health spending was growing at historically low rates. In 2017, health care spending growth returned to these lower rates and the health spending share of GDP stabilized for the first time since 2013.” 

Meanwhile, The Commonwealth Fund paints a different picture from another perspective, and has just released a 21-page DataBrief: The Cost of Employer Insurance Is a Growing Burden for Middle Income Families, with lead author Sara Collins commenting “The cost of employer health insurance premiums and deductibles continues to outpace growth in workers’ wages. This is concerning, because it may put both coverage and health care out of reach for people who need it most — people with low incomes and those with health problems. Policies that would reduce health care burdens on employees include fixing the Affordable Care Act’s family coverage glitch, requiring employers to exclude some services from the deductible, and increasing the required minimum value of employer plans.” 

The Commonwealth Fund tells us their study uses “the latest data from the federal Medical Expenditure Panel Survey–Insurance Component (MEPS–IC) to examine trends in employer premiums at the state level to see how much workers and their families are paying for their employer coverage in terms of premium contributions and deductibles. We examine the size of these costs relative to income for those at the midrange of income distribution.” 

Here’s a dozen key findings: 

  1. Average employee premium contributions for single and family plans amounted to nearly 7 percent of U.S. median income in 2017, up from 5 percent in 2008. 
  2. In 11 states (Arizona, Delaware, Florida, Georgia, Louisiana, Mississippi, Nevada, New Mexico, North Carolina, Oklahoma, Texas), premium contributions were 8 percent of median income or more, with a high of 10.2 percent in Louisiana.
  3. Premium and deductible costs amounted to nearly 12 percent of median income in 2017. Added together, the total cost of premiums to workers and potential spending on deductibles for both single and family policies climbed to $7,240 a year in 2017. 
  4. This combined cost ranged from a low of $4,664 in Hawaii to a high of more than $8,000 in eight states (Alaska, Arizona, Delaware, New Hampshire, North Carolina, South Dakota, Texas, Virginia). 
  5. In two states, Mississippi and Louisiana, these combined costs rose to 15 percent or more of median income.
  6. Premiums for employer health plans rose sharply in nearly every state in 2017. After climbing modestly between 2011 and 2016, overall premiums for employer health plans (employer and employee share) grew more sharply in 2017, by 4.4 percent for single plans and 5.5 percent for family plans. 
  7. Annual single person premiums rose above $7,000 in eight states (Alaska, Connecticut, Delaware, Massachusetts, New Jersey, New York, Rhode Island, Wyoming) and family premiums were $20,000 or higher in seven states (Alaska, Connecticut, Massachusetts, New Jersey, New York, West Virginia, Wyoming) and the District of Columbia. 
  8. Average premiums for families increased overall in 44 states and the District of Columbia.
  9. As employer premiums have risen, so have workers’ contributions. Between 2016 and 2017, employee premium contributions rose by 6.8 percent to $1,415 for single-person plans and by 5.3 percent to $5,218 for family plans.
  10. Contributions for single plans increased in 32 states, ranging from a low of $675 in Hawaii to a high of $1,747 in Massachusetts. 
  11. Contributions for family plans rose in 35 states and the District of Columbia, with the lowest increase in Michigan ($3,646) and the highest in Delaware ($6,533).
  12. The average deductible for single policies rose to $1,808 in 2017, a 6.6 percent increase. Average deductibles rose in 35 states and the District of Columbia, ranging from a low of $863 in Hawaii to a high of about $2,300 in Maine and New Hampshire.


Friday
Nov302018

EHR and Patient Self-Pay: A Tale of Two Provider Woes

By Clive Riddle, November 30, 2018

In the provider administrative world, two continuing challenges causing large audible sighs are dealing with EHRs and ever-increasing levels of patient cost-sharing. An 11-page report just released on the annual HFMA/Navigant survey tackles these topics, providing findings from responses of 107 hospital and health system CFOs and revenue cycle management executives.

On the EHR front, we are told that 56% of executives “said their organizations can’t keep up with EHR upgrades or underuse available EHR functions, up from 51% last year. Moreover, 56% of executives suggested EHR adoption challenges have been equal to or outweighed benefits specific to their organization’s revenue cycle performance.”

Timothy Kinney, managing director at Navigant, says “hospitals and health systems have invested a significant amount of time and money into their EHRs, but the technology’s complexity is preventing them from realizing an immediate return on their investments.”

The survey found that 44% quickly adapt to EHR functional release, and the above cited 56% includes 39% that underutilize available EHR functions, and 17% can’t keep up with EHR functions. Regarding adoption challenges and benefits, the also above cited 56% includes 34% stating benefits and challenges are equal, and 22% who feel challenges outweigh benefits.

Regarding patient self-pay, the report tells us that 81% of executives “believe the increase in consumer responsibility for costs will continue to affect their organizations, down from 92% last year. Among them, 22% think that impact will be significant, compared to 40% last year. Executives from health systems and larger hospitals believe their organizations will be more heavily impacted by consumer self-pay.”

Navigant Managing Director James McHugh comments that “the impact of consumer self-pay on providers will only increase with the popularity of high-deductible health plans and negative changes to the economy. Providers must take advantage of opportunities to more holistically educate patients on out-of-pocket costs, predict their propensity to pay as early as possible, and secure alternative payers or financing when needed.”

The survey results seem to indicate self-pay continues to be a big issue, yet is more manageable now than a year ago. Time will tell if that trend continues.


Thursday
Oct042018

Eighteen Things to Know from the 2018 KFF Employer Benefits Survey

By Clive Riddle, October 4, 2018


The Kaiser Family Foundation 2018 Employer Benefit Survey, an annual 200+ page definitive report of the state of employer health benefits since 1999, includes these eighteen things to know that KFF highlights:


  1.  On average, employees are contributing $5,547 toward the cost of family coverage, with employers paying the rest.
  2. Annual premiums for single coverage increased 3 percent to $6,896 this year, with employees contributing an average of $1,186.
  3. This year’s premium increases are comparable to the rise in employees’ wages (2.6%) and inflation (2.5%) during the same period. 
  4. Since 2008, average family premiums have increased 55 percent, twice as fast as employees’ earnings (26%) and three times as fast as inflation (17%).
  5. Currently 85% of covered employees have a deductible in their plan, up from 81% last year and 59% a decade ago. 
  6. The average single deductible now stands at $1,573 for those employees who have one, similar to last year’s $1,505 average but up sharply from $735 in 2008. 
  7. 26% of covered employees are now in plans with a deductible of at least $2,000, up from 22% last year and 15% five years ago. 
  8. Among covered employees at small firms (fewer than 200 employees), 42 percent face a deductible of at least $2,000.
  9. 57% of employers offer health benefits, the same as five years ago. 
  10. Some employers that offer health benefits provide financial incentives to employees who don’t enroll – either for enrolling in a spouse’s plan (13%) or otherwise opting out (16%).
  11. Overall 10% of all offering firms – and 24% of large ones – expect fewer employees and dependents to enroll because of the elimination of the ACA tax penalty.
  12. 21% of large firms report they collect some information from employees’ mobile apps or wearable devices as part of their wellness or health promotion programs (14% last year.)
  13. Most large offering employers (70%) provide employees with opportunities to complete health risk assessments.
  14. 38% of large offering firms provide incentives for employees to participate in wellness programs.
  15. 29% of firms that offer health benefits offer a high-deductible health plan with a savings option. 
  16. 61% of firms offering HDHPs only this type of plan to at least some of their employees. Overall, 29% of covered employees are enrolled in such plans.
  17. 74% of large firms (200+ employees) cover services provided through telemedicine, up from 63% last year and 27% in 2015. 
  18. 76% of large firms cover services received in retail clinics.


Friday
Sep142018

Post ACA Operating Margins: Health Systems and Health Plans

By Clive Riddle, September 14, 2018

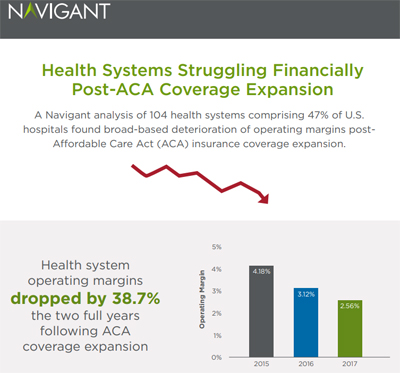
Navigant this week released an eight-page report: Stiffening Headwinds Challenge Health Systems to Grow Smarter, that provides “an analysis of a three-year sample of the financial disclosures of 104 prominent health systems operating 47% of U.S. hospitals,” in which Navigant  “found broad-based and significant deterioration of operating earnings.”


Navigant reports that from 2015 to 2017:

  • The average operating margin decline for analyzed systems was 38.7%. Not-for-profit system margins fell 34%, while for-profit margins fell 39%.
  • 65% of systems experienced operating income declines totaling $6.8 billion, with the most significant reductions occurring in the U.S.’s fastest-growing regions: West/Southwest and South Central.
  • At the root of these declines were multiyear reductions in the rate of topline operating revenue growth, which fell from 7% (2015 to 2016) to only 5.5% (2016 to 2017), and a failure to contain expenses in line with revenue deterioration. 

Navigant cites these drivers of earnings deterioration:

  1. Weakening demand for such core hospital services as surgery and inpatient admissions, due in part to rising patient cost exposure from high-deductible health plans;
  2. Deteriorating collection rates for private accounts in non-ACA expansion states;
  3. Steady erosion in Medicare payment rates due to the ACA and the 2012 federal budget sequester; and
  4. Failure of health system value-based insurance contracts to deliver sufficient patient volume to offset steep upfront payer discounts and significant hospital population health investments.

Meanwhile on the other side of the post-ACA equation, Mark Farrah Associates this week “released an analysis brief providing insights into mid-year profitability for commercial and government lines of health insurance business. MFA compared second quarter, year-over-year profitability for the Individual, Employer-Group, Medicare and managed Medicaid segments.”

They found that:

  • At the end of second quarter 2018, the average medical expense ratio for the Individual segment was 70.8%, as compared to 77.2% the previous year.
  • Growth in premiums pushed the average medical expense ratio for the Employer-Group segment down to 80.9% for 2Q18 from 81.8% in 2Q17.
  • For Medicare Advantage, premium growth outpaced increases in medical expenses pushing the medical expense ratio down to 85.3% from 86.1% in 2Q17.
  • 2.9% increase in premiums per member per month pushed the medical expense ratio for Managed Medicaid down to 88.6% from 91.0% in 2Q17.

Mark Farrah Associates concludes the current outlook is better than the one Navigant finds for health systems: “At the mid-year point, all four health care segments are signifying improved profitability for health insurers over 2017.  The most significant change is once again in the Individual segment showing improvement over 2017, which ended up being a profitable year for the segment overall.  While this analysis of mid-year segment performance sheds light upon profitability trends for 2018, it’s a wait and see proposition until final financial results are revealed in spring of 2019.”

Thursday
Aug232018

Out of Network Services: Not Just Surprise Medical Bills, They Also Erode Care Coordination and Patient Retention

by Clive Riddle, August 23, 2018

Last week, Kaiser Family Foundation released a study of medical bills in large employer plans that found "a significant share of inpatient hospital admissions includes bills from providers not in the health plan’s networks, generally leaving patients subject to higher cost-sharing and potential additional bills from providers." The report stated "almost 18 percent of inpatient admissions result in non-network claims for patients with large employer coverage. Even when enrollees choose in-network facilities, 15 percent of admissions include a bill from an out-of-network provider, such as from a surgeon or an anesthesiologist."


The focus of the KFF study of course was surprise medical bills. This week, Kyruus released their 12-page 2018 Referral Trends Report: Positioning for Patient Retention which examines out of network services from a different perspective – when referred by an in-network physician, with the issue focus being on care coordination and patient retention.

The report presents physician survey findings that indicate “one-third of out-of-network referrals would be avoidable with more robust information about in-network colleagues," and "while 77 percent of providers surveyed recognize the importance of keeping patients in-network for care coordination, a notable 79 percent say they refer patients out of network."

The report tells us:

  • Among those who refer out of network, 45 percent say that it’s difficult to determine who is in the network
  • On average, providers that refer out of network send almost 1/4 of patients out-of-network
  • 42 percent of patients leave a provider’s office without a necessary referral appointment booked, despite over 60 percent of providers considering point-of-service scheduling extremely or very important.        
  • Personal networks drive current referral behaviors: 72 percent of providers say they or their staff usually refer to the same provider for a given specialty
  • 40 percent of providers report always knowing whether or not their referral was appropriate for the patient or whether the patient needed to be re-referred, hindering care coordination.       

The report concludes that "providers understand the importance of keeping patients in network to improve care. However, without the right tools to facilitate clinically appropriate and in-network referrals, providers will not necessarily break from familiar patterns."


Friday
Aug172018

Healthcare costs – not grandchildren gone wild – the top retiree concern

By Clive Riddle, August 17, 2018


What’s the top concern about retirement years voiced by retirees as well as retirement plan sponsors? Its not grandchildren gone wild, keeping up with new technology, staying ahead of future inflation, or even staying in good health. Instead, its paying for that health.


Results just released from the 2018 TIAA Plan Sponsor Survey of 1,001 plans sponsors from nonprofit and for-profit organizations found that 91% of plan sponsors believe that healthcare costs are the most significant retirement security issue today. 54% answered very significant and 26% said somewhat significant, while 2% were neutral and – the plan sponsors I’m curious about: 3% said not at all significant.) After health care at 91%, the next highest concern of the top six: Ensuring employees are prepared to retire on a timely basis total 81% saying it was very or somewhat significant.


Meanwhile, another new survey tells us even affluent retirees are plenty scared about those retirement costs. A new Nationwide Retirement Institute survey of adults age 50+ with household income exceeding $150k, conducted by the Harris Poll indicates that 73% of affluent, older adults “list out-of-control health care costs as one of their top fears in retirement and 64 percent of future retirees say they are ‘terrified’ of what health care costs may do to their retirement plans.”


Here’s more of Nationwide’s survey findings:

  •  72% wish they better understood Medicare coverage
  •  42% admit they would give away all their money to their children so they could be eligible for Medicaid-funded long-term care.
  •  53% do not know that Medicare Part B is not free even if you have worked and paid Social Security taxes for at least 10 years
  •  23% do not know you cannot enroll in Medicare at any time
  •  29% do not know Medicare does not cost the same for everyone
  •  62% do not know that future changes will impact the ability to sign up for Medigap/Medicare supplement   plans
  •  53% are unsure or can't estimate what their annual health care will be
  •  65% are unsure what their long-term care costs will be
  •  27% of even these affluent, older adults say they couldn't cover more than $1,000 in unplanned expenses:   44% couldn't cover more than $4,000 and 60%couldn't cover more than $5,000 of unplanned expenses
  •  50 % have access to a Health Savings Account (HSA) through their employer, with 30% participating in or   contributing to the HSA


Friday
Jul202018

Consumers and Digital Technology: What’s the Deal With Healthcare?

by Clive Riddle, July 20, 2018 

The Deloitte Center for Health Solutions has just released some preliminary findings from their 2018 Survey of U.S. Health Care Consumers, which will be published in August, on the heels of their recently released Deloitte 2018 Survey of U.S. Physicians. Deloitte shares that “consumers and physicians typically agree that virtual health care holds great promise for transforming care delivery. Yet many physicians remain reluctant to embrace the technologies, worried about reimbursement, privacy and other issues.”

Thus Deloitte found consumers are well ahead of providers on the technology acceptance curve, and many providers are dragging their feet in meeting rising consumer demand in this arena. Dr. Ken Abrams, managing director, Deloitte Consulting tells us "Changes in health care reimbursement models, combined with growing consumer demand, are driving health systems to embrace virtual care, but they are struggling to get physicians on board."

The Deloitte surveys found:

  • 64% of consumers and 66% physicians “cite improved patient access as the top benefit of virtual care.”
  • “About half of physicians surveyed agree that virtual care supports the goals of patient-centricity, including improved patient satisfaction (52% agree) and staying connected with patients and their caregivers (45%  agree)
  • “While 57% of consumers favor video-based visits, only 14% of physicians surveyed have the capability today, and just 18% of the remainder plan to add this capability.”
  • “Clinicians worry about medical errors (36%) and data security and privacy (33%) associated with virtual care.”
  • “Email/patient portal consultations are the most prevalent virtual care technology used by responding physicians (38%), followed by physician-to-physician consultations (17%) and virtual/video visits (14%).”

Moving beyond just virtual care, and examining the healthcare digital experience as a whole, the global brand and marketing consultancy Prophet has just released a two part report: Making the Shift, Part I Healthcare’s Transformation to Consumer-Centricity (25 pages) and Part II  A Culture Change Playbook for Healthcare Transformation (also 25 pages.) They found that “ healthcare providers, payers and pharma companies are not making significant strides toward consumer centricity despite increasing demands and competition for healthcare dollars.”

Jeff Gourdji, a partner at Prophet, tells us  “consumers want to be treated as powerful participants in their own health.  Increasingly healthcare organizations’ own bottom lines require meeting consumers halfway or more. So, it is increasingly in everyone’s best interests to make sure consumers are empowered, engaged, equipped and enabled so they become what we call the ‘e-consumer.’”

Prophet paints the picture at the start of their report like this: “With the rise of digital technology, consumers have unprecedented power. Consumers expect business categories like retail and consumer goods to provide individual experiences across both the physical and digital worlds. While other businesses are shifting their focus toward delivering meaningful and valuable consumer experiences, healthcare has largely stayed the same. And, until recently, it hasn’t had the imperative to change. However, pressures from governments and employers to lower costs and pressures from consumers to meet ever rising expectations means that driving consumer engagement and redefining how healthcare organizations interact with people is no longer a luxury, but a necessity. While healthcare organizations are feeling pressure to upgrade their consumer experience, with a focus on how to engage and empower consumers, the path to accomplishing this is unclear.”

Immediately below this intro, the next section header asks “What’s the Deal with Healthcare?” They share survey results that “81 percent of consumers are dissatisfied with their healthcare experiences, and the happiest are those who interact with the system the least.”

Some of Prophet's other survey findings include:       

  • “Fewer than 10% of all healthcare organizations say they are “most willing” to partner with digital companies     
  • Only 21% of respondents believe that ‘practical and important innovation is coming from digital startups’ compared to over 50% of respondents who believe this innovation is coming from providers and medical device companies         
  • "Only about a quarter (27%) of surveyed companies measure relationship metrics like Net Promoter Score despite evidence that consumer metrics are critical to driving a commitment to consumer centricity.”
  • "Only 15% of respondents reported a willingness to consider adding leadership from outside the industry, even when those leaders would be supported by a healthcare-savvy team.

Prophet goes on to share on elaborate on “five shifts that organizations must prioritize to reshape into more consumer-centric businesses:

  1. Moving from tactical fixes to a holistic experience strategy
  2. Moving from fragmented care to connected ecosystems
  3. Moving from population-centric to person-centered
  4. Moving from incremental improvements to extensive innovation
  5. Moving from insights as a department to a culture of consumer obsession
Friday
Jul132018

The Physician’s Role in Today’s Healthcare Costs

By Clive Riddle, July 13, 2018

Influencing consumer behavior to reduce healthcare costs via cost sharing and engagement strategies, and purchaser cost containment strategies of all stripes have seemingly dominated discussions of regarding the cost of healthcare. So how to physicians feel about their role in the cost equation today?

A new seven page NEJM Catalyst Buzz Survey report sponsored by University of Utah Health has just been released: Cost of Care and Physician Responsibility.   The report presents findings from the University’s survey examining how clinicians view health care costs. They “found that while clinicians feel a great sense of responsibility around keeping costs affordable for patients, they don’t feel they have the tools to know, the time to discuss, or the ability to impact how much things costs,” and furthermore “the survey results show a disconnect: Physicians feel responsible for the cost of care to a patient, but not accountable for it,”

99% of surveyed physicians said that out of pocket costs are important to patients – 62% said extremely important, 32% said very important and 5% said important.  Physicians were asked “Do the following aspects of cost enter into clinical decisions at your organization?” 76% said yes to Cost to practice/system; 72% said yes to Out-of-pocket cost for patients; 68% said yes to Total cost of care; and 36% said yes to Contribution to overall national health costs.

How much impact does each of the following stakeholders have on the cost of health care? The percentage of physicians saying each stakeholders had a strong impact were:

  •           Pharmaceutical/biotech companies  - 87%
  •           Health plans/HMOs/insurers – 81%
  •           Hospitals/health systems/physician organizations – 75%
  •           Government/regulators – 67%
  •           Individual clinicians – 60%
  •           Employers – 28%
  •           Patients – 26%
  •           Medical device manufacturers – 23%

The percentage of physicians agreeing with the following statements were as follows:

  •           Health care costs are too confusing with current payer mix – 90%
  •           Physicians aren’t trained to discuss the cost of care – 86%
  •           The tools necessary to estimate costs to the patient are not available – 78%
  •           Tools necessary to estimate costs to health care delivery system, not available –77%
  •           There isn’t enough time in clinic to discuss cost of treatments with patients – 64%
  •           Physicians should make the best treatment decisions irrespective of cost – 57%
  •           Physicians should be held accountable for the cost of care to a patient – 28%
  •           It’s not the physician’s responsibility to educate patients about costs – 18%

Current strategies involving physicians are focused at the organizational level, such as with value based care and accountable care arrangements. When you get at the individual level, these survey results indicate that it would seem there is a reason current cost strategies emphasize purchaser and consumer solutions.

Friday
Jun152018

Healthcare Organization Mobile Device Use: Check That Pager

By Clive Riddle, June 15, 2018

The list of benefits derived from mobile device use by clinicians and staff at healthcare organizations is a long one. But the challenges exacted comprise a worrisome list topped by privacy and cybersecurity concerns. Organizations who promote or allow BYOD (Bring your own device) of course have significantly enhanced concerns.

So in this context its worthwhile to take a gander at the eighth annual Spok survey report: Mobile Strategies in Healthcare Results Revealed. The good news is that 57% of healthcare organizations surveyed have developed a documented mobile device strategy. The bad news is 43% have not.

They respondents say these are the challenges they are facing

  • Wifi coverage – 51%
  • Cellular coverage – 40%
  • Data security – 34%
  • Compliance with BYOD policies – 34%
  • IT support – 29%
  • Mobile adoption rates – 28%

For those with a strategy, here’s the top seven components included:

  1. Mobile management and security - 56%
  2. Mobile device selection - 51%
  3. Integration with the EHR - 48%
  4. Infrastructure assessment (wireless and mobile) - 45%
  5. Clinical workflow evaluation - 43%
  6. Device ownership strategy (such as BYOD) - 34%
  7. Mobile app strategy (in-house, third-party, hybrid) - 29%

How well are these policies enforced? 39% said extremely well, 33% said well. 24% weren’t sure and an honest 4% said poorly. With respect to validating compliance, 48% use education, 42% gather data from the devices, 37% seek feedback from the end user, 23% take surveys, and an honest 21% said they aren’t doing any validation.

With respect to devices they organization supports, 74% said smart phones, 69% wifi phones, 56% onsite pagers, 54% tablets, 45% wide area pagers, 22% encrypted pagers, 12% voice badges and 6% wearables.  

Perhaps the biggest surprise I found in the report was this passage: “Pagers are still a mainstay in healthcare. Despite the growth of other communication tools, they remain at a relatively high level of use as other mobile devices complement them (without necessarily replacing them altogether). In fact, onsite pagers are the most popular communication option for non-clinical care team members such as housekeepers, transport techs, and phlebotomists.” For non-clinical staff 54% listed some type of pager as their primary communication device (onsite 40%, wide area 10% or encrypted 4%/) Wifi phones came in at 15% and smartphones at 14%.

Thursday
Jun072018

The 260 Page 2018 Annual Medicare Trustees Report and the Part D Rx Share of the Pie

By Clive Riddle, June 7, 2018


This week CMS released the 2018 Annual Medicare Trustees Report, which provides a financial/actuarial analysis of the current state of the Medicare Fund, and projections regarding the Fund solvency going into the future.  The big takeaway always emphasized from the report is at what year in the future will the Fund become insolvent, but there really is a lot of historical information in the report worth a gander.


In regard to when the Fund is projected down, we are told the “Trust Fund will be able to pay full benefits until 2026, which is three years earlier than last year’s projections, attributable to adverse changes in program income. The Trustees project that total Medicare costs (including both HI and SMI expenditures) will grow from approximately 3.7 percent of GDP in 2017 to 5.8 percent of GDP by 2038, and then increase gradually thereafter to about 6.2 percent of GDP by 2092.”


But in addition to the voluminous portion of the report dedicated to projections taking us to near the end of the century, there’s plenty of history and present tense buried in the 260 page report as well. Here’s a snapshot from the report of Medicare in 2017:

It’s interesting to look out what portion of the expenditures are from Part D. On a gross basis, $100.1 Billion in Prescription Drug expenditures out of $702.1 Billion in benefits represents 14.3% of benefit expenditures.


But not all beneficiaries have Part D coverage, so that’s not an apples to apples percentage.

Looking at 2017 benefits for Part A, Part B, Part C and Part D combined, total benefits were $702.1 Billion, of which 29.9% ($209.7 Billion) was spent through Part C, the Medicare Advantage program. Given the analysis doesn’t break down the benefit expenditure categories for the contracting Part C Medicare Advantage plans, here’s a breakdown of the Regular Medicare expenditures including Part D (backing out Part C):

  • Hospital:  43.6% ($197.9 Billion)
  • SNF: 6.2% ($28.3 Billion)
  • Home Health Care: 4.1% ($18.4 Billion )
  • Physician Fees: 15.2% ($69.1 Billion)
  • Prescription Drugs (gross adjusted): 13.5% ($61.6 Billion)
  • Other: 17.4% ($78.8 Billion)

Regarding the Gross Prescription Drugs adjustment: You will note the above Prescription Drugs total $61.6 instead of the $100.1 Billion in the above snapshot. That’s because the Medicare Advantage Part C enrollees with Part D enrollment were backed out, given that the other benefit expenditure categories didn’t include a breakdown from Part C. So the Part C enrollment in Part D plans, as a percentage of total Part D enrollment – taken from the December 2017 Medicare Advantage/Part D Contract and Enrollment Data Summary Report - was extrapolated (61.5% of Part D Enrollees are not enrolled in Part C; 61.5% of $100.1 Billion in total Prescription Drugs expenditures = $61.6 Billion.)


But the only problem with stopping there, is not all regular Medicare beneficiaries are enrolled in Part D. There were 43.2 million PDP enrollees at the end of 2107, while there are 58.5 million total Medicare beneficiaries. Of the 15.3 million 2017 beneficiaries with no Part D, 1.9 million were from Part C, leaving 13.4 million regular(non-part C)  Medicare beneficiaries with no Part D, and 26.2 million with Part D, out of a total 39.6 million regular Medicare beneficiaries. Now if we extrapolate 66% (26.2/39.6 million) for regular Medicare with Part D, from the other benefit expenditure categories (reducing the expenditures by one third for the other categories) we can get an apples to apples look.


This will reflect the percentage benefit expenditures extrapolated for Regular Medicare beneficiaries with Part D coverage:        


  • Hospital:  40.7% ($130.6 Billion)
  • SNF: 5.8%  ($18.7 Billion)
  • Home Health Care: 3.8% ($12.4 Billion )
  • Physician Fees: 14.2% ($45.6 Billion)
  • Prescription Drugs (net adjusted): 19.2% ($61.6 Billion)
  • Other: 16.2% ($52.0 Billion)


19.2% of the Medicare benefit pie for prescription drugs, get us a lot closer to the Milliman analysis just conducted for AHIP in the commercial population, which found Rx representing 23.3% of total costs including administration. If we add in the extrapolated portion (66%) of the $8.2 Medicare administrative expenses from the above snapshot, the regular Medicare prescription drug portion represents 18.9% including administration.

Friday
Jun012018

Anthem, IngenioRx and Taking a Total View of the Prescription Drug Trend

Anthem, IngenioRx and Taking a Total View of the Prescription Drug Trend
 

By Clive Riddle, June 1, 2018


In the crossover worlds of national pharmacy chains, PNMs and health plans, we have witnessed the emergence of CVS-Aetna , Cigna-Express Scripts, and the UnitedHealthGroup’s OptumRx fueled by its 2015 acquisition of Catamaran, plus the rumored Walmart Humana pairing. Meanwhile, Anthem took a somewhat different approach, starting their own PBM from scratch instead of acquiring or merging with someone on in the Rx aisle. Thus last October Anthem announced the launch of IngenioRx, which will assume Anthem’s PBM business when its current commitments expire in 2020.


IngenioRx, thus sidelined for another year and a half – and looking to improve its visibility while gearing up – just released just released a Drug Trends Report in the same style as other national PBM reports, not letting the fact that it not yet operational serve as a roadblock. Instead, they focused reporting on the current Anthem book of business that they will be serving.


With that in mind, here’s what they shared for Anthem’s 2017 commercial population, emphasizing they were examining the total drug trend, including medical benefit and prescription benefit utilization, unlike many reports from others that are only positioned to report on the prescription benefit experience:

·         21% of Anthem’s total drug spend was administered via the medical benefit,, and 79% via the pharmacy benefit. For specialty drugs only, the breakdown was 42% medical benefit and 58% pharmacy benefit.

·         Anthem’s total drug trend was 2.0%, comprised of -4.6% non-specialty drug spend and 9.9% specialty drug trend.

·         Anthem’s 2.0% total drug trend drivers included 5.6% inflation, 1.2% new drugs costs, -0.8% reduction in utilization, and -4.0% decrease in costs due to management approaches. For non-specialty drugs, inflation was 4.9%; for specialty drugs inflation was 6.5%.


Carving out the prescription benefit to independent PBMs in the health plan world created three inefficiencies: (1) inability to manage the total drug trend due to some drugs administered through the medical benefit, as IngenioRx points out; (2) doesn’t allow for optimal coordination of care between the prescription and medical treatment components; and (3) creates duplication of administrative resources required in administering eligibility and reporting for the two components.


If IngenioRx remained just an in-house PBM for Anthem, taking the total drug trend management view will be easier, But Anthem’s IngenioRx will be a stand-alone PBM, pursuing other business as well, and requiring its own separate administrative systems, making taking a total view for the Anthem book of business a little more challenging.

 
Thursday
May172018

Medication Nonadherence: Data and Analytics Can Make an Impact

By Claire Thayer, May 16, 2018

Over two-thirds of hospital readmissions are directly due to medication nonadherence.  Many factors contribute to patients not taking their medications, including fear of side effects, out-of-pocket costs, and misunderstanding intended use.  Interventions targeted at understanding the underlying causes on nonadherence are critical to improving chronic disease outcomes.  Successful interventions include: educating patients on purpose and benefits of treatment regimen, reducing barriers to obtain medication, as well as use of health IT tools to improve decision making and communication during and after office visits. 

This weeks’ edition of the MCOL infoGraphoid, co-sponsored by DST Health, explores how data and analytics can provide insight to drive behavior change to improve adherence.

MCOL’s weekly infoGraphoid is a benefit for MCOL Basic members and released each Wednesday as part of the MCOL Daily Factoid e-newsletter distribution service – find out more here.

Friday
May112018

The Disconnect with Consumers and Health Plan Costs

The Disconnect with Consumers and Health Plan Costs
 

By Clive Riddle, May 11, 2018


eHealth this week released a new eleven page report: Costs and Consequences in the ACA Market: A Survey of Individual and Family Health Insurance Consumers, presenting findings from more than 1,700 consumers who purchased their ACA-compliant plans via eHealth that included:  (1) “Consumers’ idea of a fair price is hard to find in today’s market;” (2) Policyholders aren’t willing to pay extra for key ACA benefits;” and (3) “Voters are bringing health care frustrations to the mid-term elections this fall,” (66% said it was one of their top three issues.)


Consistent with a number of previous studies, there is a significant disconnect between consumers sense of where healthcare prices should be in the market, and what they actually are. Health reports that the average individual monthly premium cost during the last open enrollment was $400,  Only 3% surveyed felt $400+ was a fair price. Only 9% felt $300+ was fair. Only 25% felt $200+ was fair. So what is fair? 38% felt premiums should be $100 or less. Another 36% felt $200 or less was fair.


The disconnect carries over consumer sense of the value of specific benefits. 61% want mental health benefits, 60% want maternity care and 55% want birth control coverage (which are all ACA required), but only 25%, 24% and 16% respectively, want to pay for them. Even emergency room benefits experience this disconnect: 80% want the benefit and 54% are willing to pay for it.


ACA compliant HDHPs are prevalent in the ACA marketplace, and continue to gain the large group environment as well. Benefitfocus this week released a new eleven page survey report: The State of Employee Benefits 2018 - Industry Edition that examined benefit trends for four sectors: education, health care, manufacturing and retail, with an emphasis on examining the impact of HDHPs in each sector.


Benefitfocus found that regarding HDHP prevalence by sector:

·         Education: 50% of employers offer HDHPs compared to 23% in 2016.

·         Healthcare: 73%% of employers offer HDHPs compared to 56% in 2016.

·         Manufacturing: 88%% of employers offer HDHPs compared to 54% in 2016.

·         Retail: 76%% of employers offer HDHPs compared to 55% in 2016.

·         All Industries: Healthcare: 70%% of employers offer HDHPs compared to 58% in 2016.


When large employers offer other type plans and HDHPs side by side (many employers do not offer both), the HDHP employee enrollment rates by sector were: Education: 34% (30% in 2016); Healthcare: 27% (23% in 2016); Manufacturing: 29% (46% in 2016); Retail: 40% (27% in 2016) and All Industries: 35% (40% in 2016).


What would drive such different results by sector? Employee premium HDHP contributions compared to last year decreased 27% in Education, increased 4% in healthcare, increased 46% in manufacturing, increased 20% in retail, and increased 4% overall for all industries.


So just as in the individual marketplace, much comes down to price, even though there is a disconnect in the value that price reflects.

 
Friday
May042018

Welcome to Lifestyle Medicine

By Clive Riddle, May 4, 2018 

The May issue of Circulation includes the research article: Impact of Healthy Lifestyle Factors on Life Expectancies in the US Population, which presented findings from a study that aimed “to estimate the impact of lifestyle factors on premature mortality and life expectancy in the US population.” 

Using data from previous studies they defined five low-risk lifestyle factors

  1. never smoking
  2. ≥30 min/d of moderate to vigorous physical activity
  3. moderate alcohol intake
  4. a high diet quality score (upper 40%)

The study “estimated hazard ratios for the association of total lifestyle score (0-5 scale) with mortality,” and used available national public databases to estimate life expectancy by levels of the lifestyle score, examining mortality of 42,167 adults. 

They found the females who adopted all five of these low risk factors would at age 50 live 14.0 more years that those who adopted zero of the five; and that men at age 50 who adopted all five would live 12.2 years longer than those who adopted zero. They “estimated that the life expectancy at age 50 years was 29.0 years for women and 25.5 years for men who adopted zero low-risk lifestyle factors. In contrast, for those who adopted all 5 low-risk factors, we projected a life expectancy at age 50 years of 43.1 years for women and 37.6 years for men.” 

With these findings in mind, let’s stop by the American College of Lifestyle Medicine (ACLM), established several years ago as “the professional medical association for those dedicated to the advancement and clinical practice of Lifestyle Medicine as the foundation of a transformed and sustainable healthcare system.” They tell us that “Lifestyle Medicine involves the use of evidence-based lifestyle therapeutic approaches.” 

ACLM and Blue Shield of California have just announced a collaboration “to provide Lifestyle Medicine continuing medical education and other training tools to the nonprofit health plan’s in-network healthcare providers.” They tell us that “with this new collaboration, Blue Shield becomes the first health plan to offer its in-network healthcare professionals access to discounted ACLM courses, membership, conference registration, board certification review coursework and registration for the American Board of Lifestyle Medicine exam.” 

In November last year, ACLM announced the first physicians and health professionals to be board-certified in the field. They also have developed True Health Initiative (THI), “a coalition of world-renowned health experts committed to cutting through the noise and educating on only the evidence-based, time-honored, proven principles about lifestyle as medicine. The ultimate mission of the THI is to eliminate as much as 80% of all lifestyle-related chronic disease through lifestyle as medicine.”


Friday
Apr272018

Nine Things to Know Jump Out of Leapfrog Hospital Safety Grade Report

Nine Things to Know Jump Out of Leapfrog Hospital Safety Grade Report
 

By Clive Riddle, April 27, 2018


In May talk of frogs would lead one to the annual Calaveras Jumping Frog Jubilee (check out www.frogtown.com). But in April, talk of frogs leads one to The Leapfrog Group, who just released the spring 2018 edition of the Leapfrog biannual  Hospital Safety Grades. Leapfrog tells us their “grading assigns “A,” “B,” “C,” “D” and “F” letter grades to general acute-care hospitals in the U.S., and is the nation’s only rating focused entirely on errors, accidents, injuries and infections that collectively are the third leading cause of death in the United States.”


Here’s nine things to know from the Leapfrog report card results they have shared:

1.     Five “A” hospitals receiving this grade for the very first time this spring had an “F” grade in the past

2.     46 hospitals have achieved an “A” for the first time since the Leapfrog Hospital Safety Grade began six years ago

3.     89 hospitals receiving an “A” at one point had received a “D” or “F”

4.     Of the approximately 2,500 hospitals graded, 30 percent earned an “A,” 28 percent earned a “B,” 35 percent a “C,” six percent a “D” and one percent an “F”

5.     The five states with the highest percentage of “A” hospitals this spring are Hawaii, Idaho, Rhode Island, Massachusetts and Virginia

6.     Rhode Island, Hawaii, Wisconsin, and Idaho once ranked near the bottom of the state rankings of percentage of “A” hospitals but now rank in the top ten

7.     Hospitals with “F” grades are located in California, Washington, D.C., Florida, Iowa, Illinois, Maryland, Michigan, Mississippi, New Jersey and New York

8.     There are no “A” hospitals in Alaska, Delaware or North Dakota

9.     Impressively, 49 hospitals nationwide have achieved an “A” in every grading update since the launch of the Safety Grade in spring 2012


In addition to staterankings, you can search for specific hospital safety results at their webaite: http://www.hospitalsafetygrade.org

 
Friday
Apr062018

The PBM side of CVS

The PBM side of CVS
 

By Clive Riddle, April 6, 2018


Assuming the CVS acquisition of Aetna clears all final hurdles, perhaps the most attention given to the merged company is in respect to the retail synergies. But the CVS Caremark PBM also deserves considerable attention. After all, Cigna’s big merger recently announced with Express Scripts was purely a PBM play.


With that in mind, its interesting to poke through the just released 14-page CVS Health Drug Trend Report 2017. Similar to Express Scripts previously released 2017 report, the CVS Health report was certainly positive, and they touted that drug prices for clients  rose “at a minimal 0.2 percent, despite manufacturer price inflation near 10 percent.”


But it must be noted that the touted 0.2 percent increase was just for prices. There was 1.7% cost growth due to utilization, yielding a total pmpy drug trend in 2017 of 1.9%, still quite a positive trend.


Here is additional data CVS shared about their client experience in 2017:

·         While CVS drug price growth was 0.2%, the manufacturer AWP inflation rates were 9.2& for traditional brands, 8.3% for specialty brands, and 0.4% for generics.

·         The CVS generic dispensing rate was 86.1%.

·         CVS traditional and specialty brands accounted for 14% of prescriptions dispensed, but 69% of pharmaceutical spend.

·         The CVS specialty trend consisted of 3.7% price growth plus 9.2% utilization cost growth for a total 12.9% 2017 specialty trend.

·         CVS gross client costs pmpm were 108.42 pmpm in 2017 compared to $104.10 in 2016.

·         For CVS Clients with managed formularies, costs were $88.94 pmpm compared to $87.43 pmpm in 2016.

·         The managed formulary differential in overall drug trend for 2017 resulted in a 1.7% trend with managed formulary clients compared to 4.2% trend for other clients.

·         42 percent of CVS Health commercial PBM clients spent less on their pharmacy benefit plan in 2017 than they had in 2016.

·         For clients aligned with the company's managed formularies, drug price declined by 0.1 percent, in 2017, as compared to the overall 0.2 percent drug price growth.

·         Member out of pocket costs pmpm declined from $11.99 in 2016 to $11.89 in 2017.

·         In 2017 24% of members had zero out of pocket costs (no claims), 49.4% of members had out of pocket costs under $100, 14.6% had out of pocket costs between $100-$299, 5% had out of pocket costs between $300 - $499, 4.3% between $500-$599 and 2.7% above $1,000.