Search

Entries in health plans (88)

Friday
Mar282014

March Brings Three Different Slices of Health Plan Consumer Experience Ratings

by Clive Riddle, March 28, 2014

This month, three annual proprietary consumer experience studies have yielded separate slices of the health plan consumer experience. J.D. Power, Temkin Group and Saatmetrix have all weighed in, and each shed favorable light on Kaiser Permanente, among other plans.

J.D. Power released results from their eighth annual Member Health Plan Study, in which they provide member satisfaction index rankings by region. Their 2014 Member Health Plan Study is based on responses from more than 34,000 members of 136 commercial health plans across 18 regions in the United States. The study was fielded in December 2013 and January 2014.  

J.D. Power ranks satisfaction on a 1,000 point scale. Satisfaction is highest among health plan members in the California and Michigan regions (in a tie); the Indiana-Illinois and Mid-Atlantic regions (in a tie); and the East South Central and South Atlantic regions (in a tie). Satisfaction is lowest in the New England, New York-New Jersey and Southwest regions. 

Top ranked plans by region, according to the J.D. Power study, were compiled in healthsprocket, in these regional lists:

J.D. Power 2014 Member Health Plan Study: Top Plan Scores - Southern United Stated

  • Kaiser Foundation Health Plan (784) ranks highest among health plan members in the South Atlantic region (which includes Georgia, North Carolina and South Carolina) for a fifth consecutive year
  • AvMed Health Plans and Humana (in a tie at 690 each) rank highest among health plan members in the Florida region, AvMed ranks highest in the Florida region for a third consecutive year
  • Cigna (689) ranks highest among health plan members in the East South Central region (which includes Alabama, Kentucky, Louisiana, Mississippi and Tennessee)
  • Aetna (677) ranks highest among health plan members in the Texas region

J.D. Power 2014 Member Health Plan Study: Top Plan Scores - Eastern US

  • Kaiser Foundation Health Plan (732) ranks highest among health plan members in the Mid-Atlantic region (which includes Maryland, Virginia and Washington, D.C.)
  • Capital District Physicians Health Plan (727) ranks highest among health plan members in the New York-New Jersey region
  • Geisinger Health Plan (705) ranks highest among health plan members in the Pennsylvania region for a third consecutive year
  • Tufts Associated Health Plans (681) ranks highest among health plan members in the New England region (which includes Connecticut, Maine, Massachusetts, New Hampshire, Rhode Island and Vermont)

J.D. Power 2014 Member Health Plan Study: Top Plan Scores - Midwestern US

  • Health Alliance Plan of Michigan (711) ranks highest among health plan members in the Michigan region for a seventh consecutive year
  • Dean Health Plan (703) ranks highest among health plan members in the Minnesota-Wisconsin region
  • Medical Mutual of Ohio (697) ranks highest among health plan members in the Ohio region
  • Health Alliance Medical Plans (692) ranks highest among health plan members in the Indiana-Illinois region
  • Wellmark Blue Cross Blue Shield of Iowa (680) ranks highest among health plan members in the Heartland region (which includes Arkansas, Iowa, Kansas, Missouri, Nebraska and Oklahoma)

J.D. Power 2014 Member Health Plan Study: Top Plan Scores - Western US

  • Kaiser Foundation Health Plan ranks highest among health plan members in the California region for a seventh consecutive year, with a score of 756
  • Kaiser Foundation Health Plan (732) ranks highest among health plan members in the Northwest region region (which includes Oregon and Washington)
  • Kaiser Foundation Health Plan (703) ranks highest among health plan members in the Colorado region for a seventh consecutive year
  • SelectHealth (698) ranks highest among health plan members in the Mountain region (which includes Idaho, Montana, Utah and Wyoming) for a fifth consecutive year
  • Blue Cross Blue Shield of Arizona (675) ranks highest among health plan members in the Southwest region (which includes Arizona, New Mexico and Nevada

Temkin Group pronounced the health plan industry “mediocre” and bestowed the highest customer experience rankings to Kaiser Permanente and Humana respectively, in releasing results from their fourth annual ranking of companies based on a study of 10,000 U.S. consumers that “examines the quality of the customer experience delivered by 268 organizations across 19 industries: airlines, appliance makers, auto dealers, banks, car rental agencies, computer makers, credit card issuers, fast food chains, grocery chains, health plans, hotel chains, insurance carriers, Internet service providers, investment firms, parcel delivery services, retailers, software firms, TV service providers, and wireless carriers.”

Bruce Temkin, managing partner of Temkin Group, tells us "consumers give pretty bad ratings to most health plans, as this entire industry needs a customer experience makeover.  Overall, the health plan industry averaged a 56% rating in their study and tied for 17th place out of 19 industries.

Temkin ratings by plans included in the survey were:

  1. Kaiser Permanente (68%)
  2. Humana (63%)
  3. Medicare (62%)
  4. TriCare (62%)
  5. United Healthcare (59%)
  6. Blue Shield of California (58%)
  7. Aetna (57%)
  8. Health Net (55%)
  9. CIGNA (54%)
  10. Anthem (BCBS) (53%)
  11. CareFirst (BCBS) (48%)
  12. Medicaid (45%)
  13. Highmark (BCBS) (44%)
  14. Empire (BCBS) (42%)
  15. Coventry Health Care (41%).

Temkin noted that Humana (+12 points), Blue Shield of California (+7 points), and United Healthcare (+5 points) improved the most between 2013 and 2014. Coventry Healthcare (BCBS) (-18 points), TriCare (-9 points), Empire (BCBS) (-7 points), and Highmark (BCBS) (-6 points) declined the most since 2013. Kaiser Permanente with their 68% rating, was in 109th place overall out of 268 organizations across 19 industries. Humana, with a rating of 63% placed 160th overall. Coventry Health Care (BCBS) was in last place across all 268 companies in the ratings with their score of 41%.

Satmetrix Systems released results for their 2014 Satmetrix® Net Promoter® Benchmarks which measure and rank customer loyalty more than 219 brands across 22 U.S. industry sectors, including financial services, insurance, technology, online services, retail stores, electronics, travel and hospitality, and telecommunications. The Satmetrix Net Promoter Benchmark rankings are based on survey responses from more than 24,000 U.S. consumers nationwide who indicated they had significant experience with a company's products or services in the previous 12 months. A company's Net Promoter Score is based on customers' likelihood to recommend the company's product or service. The score is the percentage of customers who are promoters, rating the company 9 or 10 on a 0 to 10 point scale, minus the percentage who are detractors, rating 6 or lower.

The Satmetrix study for the health insurance sector followed these nine companies:

  • Aetna
  • Anthem
  • BlueCross BlueShield of Florida
  • BlueCross BlueShield of California
  • Cigna
  • Humana
  • Kaiser
  • Medicare
  • United Healthcare

Like J.D. Power and Temkin, Satmetrix found Kaiser Permanente to be a dominant force, leading the health insurance category for the fourth consecutive year  and “improving to an all-time high [Net Promoter Score] score of 40 points. The provider rated highest on a number of important key loyalty drivers, as patients appreciated its service features, company reputation and the feeling that Kaiser Permanente acts in their personal best interest.” Kaiser’s score was 23 points higher than the industry average. Like Temkin, Satmetrix ranked Human in second place: “with a score of 32 points, Humana saw significant improvement from 2013, moving up 14 points to beat out last year's second place finisher, Medicare (27 points).”

Tuesday
Mar112014

That's Not the Way I Always Heard It Should Be

by Kim Bellard, March 11, 2014

Now that the initial open enrollment period under ACA is drawing to a close, we’re starting to hear more about how the enrollment is going, and the news is not encouraging.

The Administration has touted that 4 million have gotten coverage through the exchanges – still several million short of their goals – but they claim to not know much about whether ACA’s impact on the uninsured rate.  Fortunately, outside organizations are helping to fill in some of the gaps. 

The McKinsey Center for U.S. Health System Reform released the results of their individual market enrollment survey, with results from February 2014.  Only 27% of those who had obtained new coverage in 2014 reported having been previously uninsured.  Even more discouraging, only 10% percent of all previously uninsured now reported having coverage.  The faint sign of hope in the numbers is that both numbers are up sharply from previous surveys – 11% and 3%, respectively – but I doubt anyone who supported ACA’s passage thought they were signing up for only helping 10% of the uninsured.

Adding insult to injury, only three-quarters of those with new coverage reported actually having paid their premium, confirming reports that health insurers had warned about.  And that percentage was only 53% among the previously uninsured, which does not inspire much confidence that they will remain insured for very long.

Perceived affordability remains the key barrier to buying coverage, even though 80% of those citing it were actually eligible for subsides, a crucial fact that two-thirds were unaware of.

One glimmer of good news is that Gallup reports that the uninsured rate has, in fact, dropped, down to 15.9% (versus 17.1% in 4Q 2013).  To be fair, though, their results showed spikes in late 2013, and the 1Q 2014 results are on par with 1Q 2013 and 1Q 2011.  Coverage through an employer dropped two percentage points from 4Q 2013, while both individual coverage and coverage through Medicaid were up by slightly under 1%.  

The Urban Institute released their own survey results on ACA enrollment, conducted in December 2013.  Among all adults 18-64, 12% reported having looked for information on health plans in the marketplace (Orwellian for “exchanges”), with another 17% planning to do so.  More significantly, among the uninsured still only 19% had looked, another 33% thought they would look – and 23% had not heard about the marketplaces.  The comparable numbers for those below 138% of the federal poverty level were 13%, 25%, and 27%, respectively, highlighting that the most vulnerable groups are not getting the message.

The picture isn’t really rosy anywhere.  The people who were already in the individual market continue to be buffeted by changes in the rules of the road.  For example, there is Administration’s executive decision to allow subsidies for policies purchased outside the marketplaces, in recognition that some consumers may have been too frustrated by the marketplace websites to buy from them. 

Then there is the “bare bones plans” mess.  After the uproar last fall about people having to lose their health plans because they didn’t meet ACA minimum standards, the Administration belated announced a one year delay in the enforcement of those standards, and has just extended that delay for yet another year, potentially meaning they won’t apply until 2016.   

It’s anyone’s guess about what has happened with premiums in the individual market.  A recent analysis by the Robert Wood Johnson Foundation in selected states found (with the exception of Alabama) more competitive markets and premiums, while a report from the Manhattan Institute last fall found an average increase of 41% (much due to benefit changes), and a study by the presumably objective Society of Actuaries last spring also expected significant increases, especially for younger consumers.

Any employer with a health plan or 401k plan – or any state Medicaid director – could have warned us that voluntary enrollment typically leaves lots of eligible people not taking action..  We should have taken the approach many 401k plans have adopted – “automatic enrollment.” Driven by disappointing participation in 401k plans, the federal law was changed to allow employers to automatically enroll employees in their 401k plan, with a default contribution rate.  Employees could still opt-out, or change the default contribution level, but employers have found that participation rates are higher and average contribution rates are higher under this approach.  What’s not to like?

This post is an abridged version of the posting in Kim Bellard’s blogsite. Click here to read the full posting

Friday
Oct112013

Health Insurance Marketplace Opening Week Enrollment

By Clive Riddle, October 11, 2013

The opening bell sounded, and public exchanges were open for business on October 1st amidst much noise about startup glitches. Health Insurance Marketplace News, in its current issue, provided the following infographic providing opening week enrollment and volume statistics for selected exchanges:


The newsletter also provided these links to releases from these exchanges with further details about their opening week activity, and the length of time the infographic data represented for each exchange:

Press Release, Covered California

Data through October 5, 2013

Press Release, Connect for Health Colorado

Data for October 1st and 2nd 2013

Press Release, Access Health CT-stats 10/8

Data through October 8, 2013

Press Release, Hawai'i Health Connector 10/2

Data through October 2, 2013

Press Release, New York Health Benefit Exchange 10/8

Data Through October 8, 2013

Press Release, Washington Healthplanfinder 10/7

Data through October 7, 2013

Taking a deeper  look at Covered California for example, we compiled the following additional statistics from their release:

  • Average wait time: 15:08 *
  • Average handling time: 16:48
  • % Applications only partially completed: 62.6%
  • Number of Californians determined eligible for coverage: 28,699
  • Small Business Health Options Program businesses registered as of 10/8/2013: 430
  • *Average wait time was reduced to less than four minutes by Friday, 10/4/2013

It will be quite interesting to see what data becomes available for the full month of October, after month end.

Friday
Jun282013

Consumer More Generous This Year with Expressing Health Plan Satisfaction

By Clive Riddle, June 28, 2013

J.D. Power has just released their excellent annual Health Plan Study of Satisfaction.  I got a different major takeaway from the study than did the folk at J.D. Power, although I also agree with their conclusions. Their take is in the context of the impending health exchange environment: “With such alternative healthcare purchasing choices as public and private exchanges--or cutting coverage altogether--taking shape among employers, health plans risk losing group business unless they improve employer satisfaction.” 


The J.D. Power study “is based on responses from 5,857 employers, with quotas to assure an adequate distribution of small, medium and large companies. The study was fielded in April and May 2013. …The study, now in its fourth year, measures six key factors that affect employer satisfaction with health plans: employee plan service experience; account servicing; program offerings; benefit design; problem resolution; and cost. Health plans are ranked in two employer segments: fully insured employers (health plan assumes the risk of providing health coverage for insured events); and self-funded employers (employers bear the risk associated with offering health benefits).”


Richard Millard, J.D. Power’s senior director of the healthcare practice  tells us “health plans need to understand the importance of satisfaction in order to limit the erosion of their business from employer-sponsored coverage to alternative channels where employees have more choices. Those health plans that focus on closing the satisfaction gap across key performance factors are more likely to retain employer-sponsored group contracts."


J.D. Power notes that “nearly one-fifth (15%) of employers say they "definitely will not" or "probably will not" continue sponsoring coverage in five years. Among employers in both segments, there is a 90-point gap in overall satisfaction scores between employers that intend to offer coverage in the future and those that intend to discontinue coverage.”


They go on to point out that “in both the fully insured and self-funded segments, employer satisfaction with program offerings, such as preventive health programs, disease management or wellness initiatives, is a key area of differentiation between employers that intend to offer coverage in the future and those that intend to drop coverage.  In the program offerings factor, the gap in satisfaction scores between fully insured employers that intend to offer coverage in the future and those that intend to drop coverage is 104 points--705 among employers that intend to offer coverage, compared with 601 among those that intend to drop coverage. Among self-funded employers, the gap in satisfaction scores between those that intend to offer coverage in the future and those that intend to drop coverage is also 105 points--689 among employers that intend to offer coverage, compared with 584 among those that intend to drop coverage.”


All good point as 2014 hovers over health plans. But what I found interesting was that health plan satisfaction scores improved significantly almost across the board for plans, compared to their 2012 study. I compiled their 2012 results with the current results J.D Power made available:


Overall Customer Satisfaction Index Scores
(Based on a 1,000-point scale)

Fully Insured Employer Segment

2013

2012

HCSC

741

697

Cigna

737

689

Kaiser

737

718

Aetna

724

670

Fully Insured Segment Average

709

675

WellPoint/Anthem

707

658

UnitedHealthcare

703

663

Humana

693

691


Self-Funded Employer Segment

Cigna

707

643

Self-Funded Segment Average

696

665

Aetna

694

682

WellPoint/Anthem

692

631

UnitedHealthcare

669

662


What is the cause of the rise in satisfaction? The 2011 overall rate full insured was 696, so the rate dropped in 2012, and rebounded even higher in 2013. What are the implications of this improvement in satisfaction as the health exchange landscape takes shape?

Here’s a graphic J.D. Power provided on fully insured satisfaction results:

Friday
Mar082013

High Deductible PPO Plans Versus CDHPs

By Clive Riddle, March 8, 2013

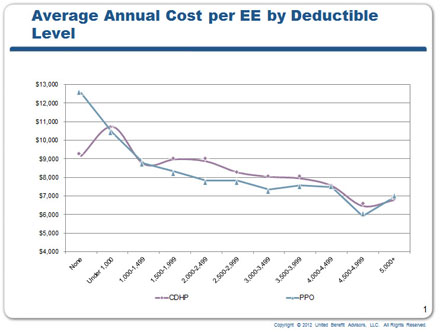
United Benefit Advisors has just released results of their annual health plan survey, with responses from 11,711 employers sponsoring 17,905 health plans nationwide, with results applicable for small to midsize companies. The survey includes a focus on Consumer Driven Health Plan (CDHP) vs. PPO comparisons of premiums, deductibles and enrollment. Their study found that “Consumer-driven health plans (CDHPs) -- high-deductible health plans (HDHPs) often paired with health savings accounts (HSAs) or health reimbursement accounts (HRAs) -- are not achieving long-term savings greater than what would be reached by raising the deductible on traditional PPOs.”

Unlike most national large employer benefit consulting firms, UBA – whose survey concentrated on smaller firms – is not bullish on account based plans, and would rather place their bets on straight PPO plans with a higher deductible. Although one could argue, it might be easy to make a stripped down high deductible PPO health plan yield immediate lower costs than a CDHP that has account administration costs, up-front wellness benefits and other bells and whistles. That doesn’t necessarily mean the PPO HDHP would be the best long term solution for an employer’s and employee’s objectives, unless immediate premium costs is the only concern.

UBA CEI Thom Mangan tells us “Employers are turning to CDHPs as a cost-cutting solution against the relentless upward spiral of health care costs. However, our research shows that small-to midsize businesses in particular, who may be considering these plans may first want to consider increasing the deductible on the plans they already have to achieve the same initial savings. Or, prior to implementing a CDHP plan, employers should build a culture of health and wellness in their workplace that drives employee behavior towards quality, low cost medical care and prescription drugs.”

Here’s some of the data UBA has shared from their findings:

  • Nearly 60 percent of the 11,711 employers surveyed said they plan to offer a CDHP in the next five years
  • PPOs remain the dominant plan type with 61.7 percent of U.S. employee enrollment
  • The greatest savings of a PPO over a CDHP was achieved with a deductible of $2,000-$2,999, where PPO cost per employee was $7,811 and CDHP was $8,859, a savings of $1,000 per employee.
  • Savings created by CDHPs over the plans they were replacing or HSA, averaged 1.75 percent in 2012, a significant reduction from prior years.
  • Enrollment also decreased to 15.6 percent (a 1.8 percent decrease from 2011), and nationwide enrollment among employers with 1,000 or more employees dropped substantially from 15.9 percent in 2011 to 11.3 percent in 2012.
  • The area of the country that has seen the biggest increase in CDHP growth is Minnesota, which saw the percent of employees enrolled in CDHPs increase from 15.5 percent in 2010 to 37.1 percent in 2012, a rate 18.4 percent higher than the national average in those same years.
  • Other areas with rapid CDHP growth include Indiana, Virginia and the Northeast region. The only western state to see CDHP popularity increase was Oregon, where percent of employees enrolled in CDHPs increased from 12 percent in 2010 to 20.3 percent in 2012.
  • Overall, CDHP enrollment in the west is the lowest in the country with only 7.7 percent of employees covered, a slight increase from 7 percent in 2011 and 4.6 percent in 2010. HMOs account for 31.3 percent of the market in the west.
Thursday
Feb072013

Who’s In: State Health Insurance Exchanges

By Cyndy Nayer, February 7, 2013

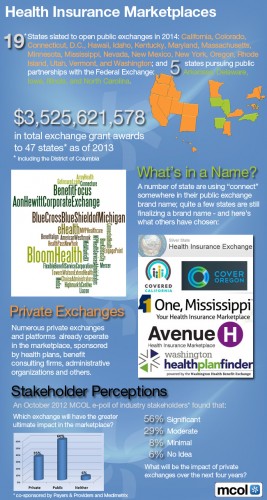
MCOL published the infographic that shows the participants (states) in health insurance exchanges (HIX), the monies invested, the managers of the exchanges, and the public v private efforts. To date:MCOL state Insur Exchanges

  • 19 states are expected to open an exchange in 2014.
  • Over $3.5 billion has been invested in 47 states (including the District of Columbia).
  • Private exchanges are developing, mostly through large consulting firms, health plans, and integrated delivery systems.
  • 56% of people polled by MCOL think that health insurance exchanges will have a significant impact on health access and affordability.
  • Update on Florida (not on the infographic): the first state to oppose the exchanges, is still considering the impact on the budget.

As health care reform spreads through the communities of the US, there is great hope that the insurance exchanges will, in a few short years, encourage more consumer-driven health management. What is happening, however, is the escalation of insurance premiums even before the uninsured are offered entry into the coverage marketplace. This will demand a much finer focus on keeping people in sync with their prevention, wellness, and chronic care management plans. It means that those who are proficient at health care purchasing–the self-insured employers–will need to keep a close communication package in place, encouraging appropriate use of services and screenings as well as attention to adherence to medical plans. Some employers have already shared that they will be offering a “step-up” insurance package to their beneficiaries, as they have reaped the rewards of value-based benefit designs and outcomes-based purchasing through the years. They believe that their commitment to a high-performing workforce will be continue, even if their employees and families enter the exchange marketplace.

Wednesday
Apr182012

DME: A Modest Proposal

By Laurie Gelb, April 18, 2012

What's a "convenience item?"

For most plans, it's anything from the elevation feature of a wheelchair seat to a motorized patient lift to a track to move a shower chair into a traditional stall. In other words, it's features, equipment or supplies that you don't want to reimburse.

The rationale for non-reimbursable DME is most often that in and of itself, the "convenient" add-on or gadget doesn't treat a disorder or isn't essential for ADLs. A power wheelchair's tilt and recline functions, for example, are reimbursed because without them a chair-bound patient is more likely to acquire pressure ulcers, which are costly to treat. But vertical elevation -- that's just patients trying to belly up to bars and kitchen counters, right?

Not only.

Often, the elevation feature is used to prolong the time until a passive lift is necessary for transfers. The same is true of hi/lo beds.

So what?

Watch an assisted standing transfer with a confident patient and assistant. Then watch a lift transfer as the patient dangles from a sling, often scraping body parts against a metal frame and risking already-fragile joints and skin. Which one do you prefer from a cost standpoint?

Taking the whole wheelchair higher may also enable use of a urinal or bedpan (supplies that you don’t pay for, whereas you do pay for catheters + the infections they cause), to make it easier for tall helpers to place a lift sling (or to do pivot transfers with more agile patients), for dressing, feeding and many other purposes. If you think about those specific activities, it’s evident that neither tilt (angled seat) nor recline (angled back) can substitute for elevation in those situations.

Now back to reimbursement. Not only is elevation per se often considered a “convenience, but often it’s not even submitted for reimbursement. Many patients don't even ask for it, even if they are aware it exists, because their DMEs tell them not to bother. Sit-to-stand lifts and chairs are another example of usually-unreimbursable items that yield huge health outcomes for appropriate patients, from avoiding hospital stays for impaction to improved respiratory function.

Much very pricey DME, from mobility to respiratory aids, is never submitted for reimbursement because of time pressure (quicker to buy from the Internet or as self-pay); complexity of the reimbursement process; pressure from a DME to file the easy part; a required preauth wasn't filed in time; DME annual limits and/or specific exclusions.

Is all the DME being bought and sold via the Internet (whether Craigslist or DOTmed) or donated by others good or bad for MCOs? To the extent that it's not reimbursed, you might think that it's just fine. But then turn full circle for the sequelae of obsolete, inappropriate and/or flat-out dangerous equipment and you'll see plenty of potential costs.

Ill-considered Internet purchases and donations aren't the only threat to DME safety; wheelchair-bound/NIV patients who "give up" on or wait forever for unresponsive DME firms who avoid service visits (in part because reimbursement is so uncertain) are practically a cliché.

Visit the homes of the chronically ill, even those comparatively well off and with private coverage, and you'll see fraying slings holding patients whose fall would mean a final hospital stay; rusty equipment with unpredictable steering; BiPAP and even vents being used improperly because no one in the household knows how to titrate them and can't get anyone to help; family members (likely in your network as well) risking severe back injuries because the right equipment for transfers/showering/toileting isn't available.

Some paras and quads "eat like dogs" (often choking in the process) out of bowls because they don't have access to a helper to feed them, and of course wheelchair trays and special utensils aren't covered. Nonetheless, your budget will take a hit at some point, and nutritional status compromised by illness comes under the heading of medical need in most textbooks.

Undeniably, your DME charges for lease months and sales for what you do cover, are way more than patients can pay on the Internet or elsewhere. And this goes back to inflated manufacturer pricing, often in expectation of contracted discounts but also in some cases, simple greed.

The root cause: contracted prices and often suboptimal product quality/selection deplete your DME budget to the point that you can't see a business case for the simple items that would pay for themselves and support your case for "caring" as well. Moreover, DME caps basically tell patients to go anywhere but the traditional system to access equipment. How predictable are the outcomes of back alley DME acquisition?

To put it another way, how much do you know about Helen Jones' fall because the eight-year-old walker passed on from her great-aunt wasn't gripping the sidewalk any longer? You paid for her hospital stay and rehab for a broken hip, and she may need home health on discharge. She didn't know that her walker needed new feet (nor would she have known where to get them), because she has low vision and no one she knows has any familiarity with checking walker feet.

No one teaches us about DME; the provider/plan Web sites so thick with rich media ignore it, so the major sources of information on DME are patient forums and YouTube videos, neither of which Mrs. Jones, 82, is likely to access.

The reciprocal of DME providers’ natural desire to remain profitable, is patients who don't know the system, who don't know when/how to use network benefits and when/how not to; how to access help with equipment that they need to have, or that doesn't work how they need it to; and a system that seems massively disinterested in the change that everyone "agrees" is needed. We obsess about medication errors that leveraging IT and FMEA can fix, but don't touch a larger, increasingly relevant (checked the age trend of your membership lately?) issue.

Beyond medical costs, MCOs incur the cost of fraud. I’ve seen recent drastically upcoded invoices to MCOs from DMEs that patients and family members, exhausted from the calls needed to obtain a facsimile of necessary equipment, not to mention the burden of care, didn't even perceive, or when they did perceive them, didn't blink. Why should they care if the MCO pays more than its contract stipulates, for something they never received, when they perceive that the MCO is depriving them of needed equipment and help?

From the other side, I've seen invoices with incorrect patient names, provider names, equipment codes and diagnosis mismatches sail through (as with home health, but that's another story). The DME claims processing burden is great on the payor side as well. The complexity of regulations for the sake of cost control are only getting worse.

The US managed care maze has also kept many highly-rated European manufacturers out of the US market entirely, except for authorized facility-only distributors, who don’t want the hassle of selling to home care.

Does US access to European products matter? Well, only if you’d like your members to have access to options like wool and fleece lining for slings to protect delicate skin; smaller patient electric lifts and tracks to use in apartments, as opposed to relatives’ [insured by you?] backs; freestanding track systems to reduce mobile lift risk, better repositioning aids, etc. Oh, but wait --none of these are usually covered items, anyway. Well, therein lies part of the problem.

Now imagine that DME was reimbursed like an office visit or injection. Provider in network? Check. Correct coding? Check. Eligible patient? Check. No duplication within six months (just as we don't reimburse two fills for the same med if dose is available or two right leg amputations)? Check. Not experimental? Check. Medical/ADL use (like, not a scooter flag or strobe light)? Check. Then you process the claim.

  • How much would you lose?
  • How much would you and patients gain?
  • How much admin cost would you save?

Sure, you'd cap coverage at one power chair per interval, and other obvious constraints. But a track to get quads into a shower, yes, you'd pay (paid for any skin infections or UTIs lately?). Or an elevator on a power chair. Or a new sling to replace the one that’s frayed past safety.

And on this planet, reputable Internet suppliers could be in-network, too. Yes, certain manufacturers would be upset by this. But, down the road, how long can you continue the game? We’re not in Kansas any more.

Could you pilot a low-complexity DME program for certain dx? Patients at risk and/or high utilizers? Maybe in conjunction with existing disease management? Of course you could. Medicare, Medicaid or private plan, everyone’s feeling the pain (quite literally).

And why would you make the effort? Because the next patient held hostage to inadequate equipment and support may be someone you know.

Tuesday
Mar272012

Fail to Prepare, Prepare to Fail

By Lindsay Resnick, March 27, 2012

For health plans looking at the period leading up to the Affordable Care Act’s 2014 big launch, it’s a critical time. We’re about to see the most jarring market reforms ever. Even with the uncertainty of the Supreme Court decision and 2012 election, can Plan’s really afford to sit on the sidelines and watch valuable time tick away? The retailization of healthcare is coming, and preparation is key.

Which of reform’s changes are going to stick…which will fade away? How will existing competitors react…which new ones will appear in your markets? Can you move from a B2B to B2C marketing culture?

Tough questions need to be asked (and answered) about legacy core competencies in tomorrow’s reformed marketplace. In other words, sustainability of your health plan’s value chain—the series of individual activities within your enterprise that when linked together, combine to add comparative value to a final products or services.

It’s time for a serious look at four critical areas of focus.  Here are some questions to spark internal debate and begin an ACA transformation assessment:

  1. Brand Position What’s your unique selling proposition in a reformed marketplace likely to see increased competition and disintermediation the individual and small group markets by Exchanges?
  2. Customer Segmentation Are you quantifying and profiling new customer segments that you’ll be serving in 2014: previously uninsured, pre-ex time-bombs, newly subsidized, abandon employees, Medicare boomers, etc. to be sure you have the right product mix?
  3. Customer Acquisition Are marketing’s multi-channel lead generation tactics (e.g., traditional direct response, digital, social media, mobile) being optimized across all distribution outlets (e.g., field agents, telesales, online, mobile, retail)?
  4. User Experience Is your health plan delivering a personalized customer experience driven by retention metrics and built around superior member engagement using a managed touchpoint discipline?

Retail healthcare, product standardization and price transparency levels the playing field. Health plans need to refresh their toolkit of customer acquisition and retention tactics. It means protecting and expanding relationships with their existing customer base across product-lines and market segments. And, to grow market share it means strengthening direct-to-consumer marketing tactics and bolstering sales distribution to facilitate (and influence) customer choice.

For a free copy of the Solutions Brief, "Healthcare Reform Readiness: A Transformation Toolkit", click here:  http://bit.ly/z3VLkE

Friday
Feb172012

Kaiser by the Numbers - 4th Qtr 2011

By Clive Riddle, February 17, 2012

Kaiser Permanente, the nation’s largest integrated health care delivery system, last week released fourth quarter and year-end 2011 financial results.  Here’s some highlights, as well as comparison to their fourth quarter and year-end 2010 and 2009 financial results:

Full Year End Results

  • Combined total operating revenue:  2011 $47.9 billion  |  2010 $44.2 billion  |  2009  $42.1 billion
  • Operating income:   2011 $1.6 billion  |  2010 $1.2 billion  | 2009 $1.6 billion
  • Operating Income % of Operating Revenue:  2011 3.3%  | 2010 2.7%   |  2009 3.8%
  • Net non-operating income:  2011  $426 million  |  2010 $789 million |  2009 $524 million
  • Net income:  2011 $2.0 billion | 2010 $2.0 billion  | 2009 2.1 billion
  • Capital spending :  2011 $3.2 billion  |  2010  $2.9 billion  |  2009 $2.6 billion
  • Total Membership:  2011 8.9 million  |  2010 8.7 million  |  2009 8.6 million

Fourth Quarter Results

Combined total operating revenue:  2011 $12.1 billion  |  2010 $11.1 billion | 2009 $10.6 billion

Operating income:  2011 $247 million  |  2010 $42 million |  2009 $214 million

Net non-operating income:  2011 $227 million  |  2010 $205 million  | 2009 $276 million

Net income:  2011 $474 million  |  2010 $247 million  |  2009 $490 million

Capital spending:   2011 $1.0 billion  |  2010 $1.2 billion  |  2009 $900 million

More Numbers

High level browsing of KP’s financial results can be given a little more perspective by touring through some key information about the close to 9 million member not-for-profit health plan:

  • Founded in 1945
  • Headquarters in Oakland, Calif.
  • Three main operating entities:  (1) Kaiser Foundation Hospitals and their subsidiaries;  (2) Kaiser Foundation Health Plan, Inc.; (3) The Permanente Medical Groups.
  • 2010 Health Plan Membership, by Region:  Colorado: 526,258; Georgia: 222,074; Hawaii: 229,186; Mid-Atlantic States (VA, MD, DC): 488,171; Northern California: 3,263,619; Northwest (Oregon/Washington): 476,345;  Ohio: 122,342; Southern California: 3,341,646
  • 2010 Medical facilities and physicians: 36 Hospitals; 533 Medical Offices; 15,853 Physicians;  167, 178 medical facility employees
Monday
Oct032011

More, Please

By Kim Bellard, October 2, 2011

Private health plans – everyone’s favorite scapegoat – are getting rolled.  They might as well get used to it.

Kaiser Family Foundation released its annual Kaiser/HRET Health Benefits Survey, which showed that health insurance costs increased 9% for family coverage – over $15,000 per family annually.  This compares to last year’s more promising 3%.  Single coverage was up by an equally daunting 8%.

What struck me was Kaiser’s estimate that health care reform accounted for 1-2 percentage points of the increase.  It’s a good thing for the Administration, then, that the overall increase was as large as it was, so that the effects of health reform couldn’t be blamed for a larger share of the private sector health spending increases.  Whether that proportion is one-ninth or one-third of the total, though, it’s still a lot of money.  Private health insurance expenditures are on the order of $850 billion, so that 1-2% increase is a cool $8.5 - $17 billion hidden tax increase annually.  And it’s only starting. 

Just a few days ago, there were various news reports trumpeting the success of Affordable Care Act (ACA) in getting more young adults coverage, via the requirement to cover dependent children up to age 26.  Both the CDC and Gallop released findings validating the increase in coverage, estimated at some 900,000 more young people with health insurance.  But insuring these young adults has a cost.  The Kaiser study reported 20% of firms have covered young adults due to the law, an estimated 2.3 million adult children.  The difference between the 900,000 and the 2.3 million suggests a majority of those adult children might have obtained coverage on their own rather than through their parent’s insurance.  If I were an employer trying to cover my health insurance costs, I might be kind of mad about that.

Kaiser also reports that the ACA impacts are just starting to be felt.  Seventy-two percent of employers still had “grandfathered” plans, which have not yet been fully subject to ACA requirements.  Among those requirements are coverage for specified preventive care services without deductibles or cost-sharing.  Last month we saw one shoe drop in this regard, when HHS announced the list of services considered preventive for women’s health.  The services include not just birth control, but also, among others, HIV screening and counseling, breastfeeding support and supplies, and domestic violence screening and counseling – all very worthwhile services, but not all ones traditionally seen as either preventive in nature or covered by health insurance.  Then again, the federal government is requiring the private sector to pick up the costs, so serving political or social justice goals becomes part of the equation.  The Wall Street Journal reports that Catholic organizations are, not surprisingly, already upset with the requirements about contraception, and it will be interesting to see how special interests play out against other special interests in achieving ACA’s goals.

It’s going to be very tempting – too tempting – as ACA moves forward, for more special interest groups to lobby to get their services covered at no cost-sharing to the consumers.  No cost-sharing to consumers, of course, doesn’t mean no cost; it all has to get paid for somehow, and it all adds up.  We’ve been down that road with state mandates for health insurance, except that under ACA there are no jurisdictional escape routes for employers or health plans. 

Critics of health insurers, of whom there is no shortage, blame the 9% increase on health insurers trying to make their money before they are required to hit the loss ratio and disclosure requirements of AAPCA.  Those critics might want to note that Kaiser also reports that 60% of covered workers are in self-insured plans, so their argument loses much of its force, as these firms have no incentive to raise their costs any higher than necessary.  Self-insured or not, employers provide the vast majority of private health insurance, and they are struggling to afford it.  They are not an endless piggybank to be used for political purposes. 

The only “good” news about ACA I’ve seen lately is that the Administration is finally being forced to be more honest about the CLASS long term care program.  Skeptics of this program, including me, argued that the program was not structured to be sustainable. It was included as a tribute to Senator Ted Kennedy and as a way to count the program’s initial years’ premiums as revenue in the bill’s cost – rather than reserving them to pay for promised benefits.  Now it appears that HHS may try to not implement the program, having gotten rid of the actuary assigned to work on it and reportedly planning to close down the CLASS Office.   I feel bad for the people who might have benefited from CLASS, but as a taxpayer I’m relieved that we might not have jumped off this particular cliff yet.  

It remains to be seen if the 9% increase in costs is an aberration or the start of an ominous trend.  As the various ACA changes more fully impose direct costs on private health plans, and as providers continue to cost-shift to private payors due to worsening Medicare and Medicaid payment shortfalls, the prospects for holding costs down are grim.

Bad as they are, the cost increases could be worse.  Consumer Reports found that 48% of consumers are skimping on prescription drugs or other forms of medical care, up from 39% last year.  Presumably costs might be higher if patients didn’t “skimp” on health care, which included delaying a doctor’s visit or declining a test.  Of course, this concern about “skimping” on health care should be counterbalanced by questioning whether all of the recommended care was needed.  A recent study found that 42% of primary care physicians think their patients get too much medical care, driven in part by malpractice concerns and ordering tests rather than spending more time with patients (see my previous blog on addressing this).  They thought sub-specialists were even worse in this regard; 61% thought sub-specialists provided too much care.

The fact of the matter is that we still don’t know how to tell what care is needed and what isn’t, and ACA hasn’t helped accomplish that.  Yet.

Perhaps HHS will get the ACO regs right, and ACOs will flourish.  Perhaps EMRs and meaningful use will quickly yield the desired paybacks.  Perhaps the exchanges will be a boon for consumers and health plans alike.  Perhaps, perhaps, perhaps; the big problem with ACA was that it focused primarily on how health insurance is financed, not on making structural changes to how we deliver and pay for health care.  Until we do the latter – health plans, better open your wallets (and by “your wallets,” I mean “spend our money…”)!

Monday
Sep262011

Medicare Marketing’s Top Ten

By Lindsay Resnick, September 26, 2011

With compliance scrutiny at an all-time high, a selling-season that has been dramatically shortened, and bonus payments and year-round marketing directly tied to the CMS Star Rating system—managing Medicare Advantage aren’t getting any easier. Add to the mix a surge of baby boomers entering the Medicare marketplace at a rate of almost 10,000 every day and one thing is for sure…you better have your Medicare marketing house in order.

Below are our Medicare Marketing’s Top Ten success factors to help sharpen your approach and meet or exceed stakeholder expectations. 

  1. Understand the impact of CMS COMPLIANCE – Today’s Medicare marketers must understand and respect the important role CMS compliance plays in the member acquisition process. This means making sure the link between marketing, sales and compliance is as strong as possible, always supporting the spirit of CMS consumer protections.
  2. Be DATA DRIVEN to ensure a strong foundation – Always start with data. It needs to be sorted, cleaned, refined, and turned into actionable marketing intelligence. From building predictive models for most likely responders to variable direct response call-outs to optimize media buys, the goal is to bring a grow while continually lowering your cost per lead and cost per sale. 
  3. Modernize your AGE-IN process – With thousands aging into Medicare every day, new approaches are needed to attract today’s boomer-seniors. “It’s not your Daddy’s Medicare.” It takes a combination of meaningful education, sequenced messaging, and innovative approaches to outreach to connect with newly eligible beneficiaries. 
  4. RETAIN MEMBERS to increase ROI  – In a fiercely competitive Medicare market, aggressive “switcher” campaigns have become routine. The cost of acquiring a new member is 5X the cost of retaining an existing one. Loyalty-based member engagement plays a big role in a health plan’s long-term profitability under the label of member LifeTime Value. 
  5. STAR RATINGS impact the bottom line – As CMS deploys its 5-Star Rating across Medicare plans, marketing’s role is critical to ensure member communications reinforce customer satisfaction. Engagement marketing goes a long way in a plan’s ability to achieve the highest possible Star Rating and the bonus payments that go with it.
  6. CUSTOMER INTERACTION makes a key difference – Give beneficiaries a reason to engage and connect with a Medicare plan they trust. It’s all about them. It takes tested, personalized direct response marketing that create opportunities for one-on-one interaction to communicate value and answer a Medicare beneficiary’s most important question, “What’s in it for me?” 
  7. Don’t ignore DIGITAL MEDICARE – As more and more Medicare shoppers use the Web as their primary research tool, it’s essential to have a Medicare online experience that’s user tested, compelling, and built for seniors. From ease-of-navigation to the images and words on your website, it needs to be tailored to your Medicare audience.
  8. Consider MULTI-CHANNEL SALES that match customer preferences – Different Medicare customers require different doors of entry….some will call on the phone; others come in through a website; some prefer to respond via mail;  many like a discussion across their kitchen table; and, others may even desire a retail experience. A multi-channel sales distribution strategy is critical to success. 
  9. Understand your DIFFERENTIATED VALUE – Being the health plan of choice for Medicare beneficiaries is achieved by building trust, credibility and relevancy around your value proposition. This means understanding drivers that motivate prospects to select your plan, and an ability to get the most differentiated and preferred product offerings in front of them. 
  10. Measure MARKETING ROI to determine actual results – You can’t manage what you can’t measure! Combining sophisticated upfront data analytics, direct response discipline and flawless campaign execution can significantly lower member acquisition costs and increase retention. Tracking, analyzing and measuring results throughout the marketing cycle is a Medicare marketing must. 

Successful Medicare marketing hinges on educating seniors, defining value and creating motivated buyers. It takes learning as much as you can about your target market so you understand what’s important to them, what concerns them, and what they want from their Medicare plan. It will go a long way toward answering Medicare beneficiaries’ number one question—what’s in it for me?

Thursday
Aug182011

Kaiser Permanente by the Numbers -2nd Qtr 2011

By Clive Riddle, August 19, 2011

Kaiser Permanente earlier this month released highlights from their quarterly financial operating results.  Not being a for-profit publicly held plan, Kaiser’s numbers don’t always get the same level of attention as their national counterparts. Here’s some selected figures worth reviewing. Please note as an integrated system, they are combined results for Kaiser Foundation Hospitals, the Health Plan, and various subsidiaries.

  • Combined operating revenue was $11.9 billion for the second quarter 2011, compared to $11.0 billion in 2Q 2010. For the six months ending June 30, 2011, total operating revenue was $23.9 billion, compared to $22.0 billion for the six months in 2010.
  • Operating income was $390 million in the second quarter of 2011, compared to $313 million in the same quarter last year.  Year-to-date (thru June) operating income was $1.0 billion, compared to $794 million for the same period in 2010.
  • Net non-operating income was $273 million in the second quarter of 2011, compared to $91 million in the same quarter last year.  Net non-operating income was $564 million in the first six months of the year, compared to $316 million in the same period last year.
  • Net income for the second quarter was $663 million versus net income of $404 million in the same period last year.  Year-to-date net income (thru June) was approximately $1.6 billion, compared to $1.1 billion for the same period in 2010.
  • Capital spending in the second quarter of 2011 was $735 million, versus $576 million in the same quarter of last year. Capital spending for the first six months of 2011 was approximately $1.4 billion, compared to $1.0 billion in the same period last year.  Kaiser notes they have opened 13 new and replacement hospitals and 86 medical office buildings in California over the last five years.
  • Kaiser Permanente membership increased 208,000 members during the first six months of 2011, now totaling more than 8.8 million overall.
  • Currently, kp.org serves over 100 million visitors each year. Year-to-date in 2011, members have securely viewed 34.8 million laboratory results, exchanged 6.2 million emails with their Kaiser Permanente caregivers and refilled 4.6 million prescriptions online.

Not a bad showing. Operating revenue for the first half year is $1.9 billion more than the first half of 2010;  net income is $0.5 billion more over last year for the first six month, and membership went up, not down.

 Executive Vice President and Chief Financial Officer Kathy Lancaster shared in a statement that “our year-to-date operating margin of 4.3 percent was in line with our financial plan. Our operating results, coupled with a sound investment strategy, enable us to reinvest in health care facilities, technology and programs that are essential in continuing to meet the needs of our members, patients and the communities we serve.” 

Should you want to check out how the major publicly held health plans performed in the second quarter of 2011, listen to the MCOL Quarterly Reports Podcast (August 2011) featuring Doug Sherlock, of Sherlock Company.

Monday
Jun132011

The Two Percent Solution

By Kim Bellard, June 13, 2011

Blue Shield of California recently announced that they would be limiting profits to two percent of revenue.  The move is believed to be one of the first of its kind, and is one of a series of bold positions on health reform that the company and its CEO, Bruce Bodaken, has taken over the years.  The company is even applying the limit retroactively, refunding last year’s profits over that level, some $180 million.

To be fair, Blue Shield of California has had its share of critics over the years, including criticism of recent rate increases or proposed increases and over compensation for its key executives.  The recent announcement has similarly drawn its share of skeptics, some of whom noted that California is currently considering giving the Department of Insurance the ability to reject “excessive” rate increases.  They speculate Blue Shield is trying to head off the increased oversight. 

I won’t presume to speculate on Blue Shield’s motives, and I’ve been in business long enough to know that companies have many accounting options to classify a good deal of money in ways that can help keep it from showing up as profit.  Still, I wish Mr. Bodaken had gone further.  Perhaps he should have called for a “2 percent solution” across the board for health care, or at least for its non-profit constituents. 

People love to pick on health insurers, perhaps because their premiums are one of the more visible costs to consumers in our health care system.  Health insurers often don’t make it easy to defend them, but their level of profits is probably one of the harder aspects to attack.  One economist points out that the health insurance industry ranks only 86th in profitability, with an average profit of 3.3%.  Profits from drug manufacturers, health information services, home health care companies all dwarf those of health insurers.  Granted, that data is a couple years old, but 3-5% is a typical profit margin for health insurers. 

Contrast this with a more beloved sector of the health care system, non-profit hospitals.  Moody’s estimates that non-profit hospitals made, on average, 2.3% in 2009.  Larger hospitals fared better; the 50 largest hospitals made 3.5% on average.  The IRS took a look at non-profit hospitals a couple years ago, and found an even bigger number.  In their review, non-profit hospitals’ “excess revenues” (total revenues less expenses) averaged 5%.  Rumor has it that some large health systems in my region of the country enjoy 10% margins, and it wouldn’t surprise me if that was less rare than many people would think.  So neither Blue Shield’s 2% limit, nor even their 2010 margin of 3.1%, look out of line.

One wonders if non-profit hospitals will be bold enough to follow Blue Shield’s lead and vow to limit their margins to 2%.  One also wonders if it would make any difference.

More troubling is the kind of practice the Wall Street Journal reported on recently, regarding physician-owned distributorships, or PODs.  Essentially, PODs are a way to give physicians a cut of the revenue from medical devices that they prescribe to, or implant in, their patients.   Not surprisingly, they found, for example, surgeons tended to perform more spinal implants when they were part of such arrangements, and not always for the better health of their patients. 

The Journal has been running a periodic series on various questionable provider billing practices, using Medicare Part B claims data (which, by the way, it had to go to court in order to get access to).  Their article on the potential adverse impact of PODs has now spurred a Senate Finance Committee report and a request for the HHS Inspector General to take a closer look.  Every time I read one of these articles, I’m struck with two equally strong reactions: how much of this kind of chicanery is there, and why the hell isn’t CMS doing more to identify and combat it? 

Physician ownership of other health care entities, which now include ambulatory surgical or imaging centers, pharmacies, and even hospitals (although health reform has put a halt to the latter, at least for now), have been linked to higher utilization (e.g., see Hollingsworth).  Defenders of the practice deny such links, arguing that they actually lead to higher quality or even to lower costs, but, honestly, it must be hard to say that with a straight face. 

Ironically, it seems like the one area where physicians seem to have less desire to own are physician practices themselves, which have seen a sea change in ownership by hospitals.  Less than half of physician practices remain independent.

Maybe ACOs and/or bundled payments will solve this problem, which I would refer to as self-referral had Rep. Stark not already claimed that term (although his efforts obviously have not met with persistent success), but I’m not optimistic.  It just seems like the people figuring out how to make more money from the health care system are smarter than the people writing and enforcing the rules that try to restrict them.  Or they have better lobbyists.

To be fair, I don’t really care all that much about who owns what or even how much their profit margins are.  What I care about with health care is if I receive the right care at a reasonable price…it’s just that both of those remain fairly nebulous concepts.  In health care, more than in any other sector of the economy, I want to have confidence that the people and organizations providing services to me care more about my well-being than they do their own financial well-being.  Those don’t have to be incompatible, but how do I know when they are?

Which leads me back to Mr. Bodaken’s bold effort.  The point is that profit margins may not be the best way to evaluate health plans.  Nor are medical loss ratios.  The proof of the pudding is in the eating, and the proof of health insurance is how expensive it is, relative to the benefits.  From a societal standpoint, we want to ensure that insurers don’t get to lower premiums by unfairly denying claims, providing poor service, or cherry-picking the healthier members.  If a health insurer really achieves lower premiums because they have better deals with providers or manage the health of their members better, why should we care what their profit margin is? 

Profits are not, in themselves, a bad thing, and I don’t understand why some people seem to think they are especially bad in health care.  It’s about demonstrating value.  After all, Apple makes close to 25% on its products, and people seem to love them.  Too bad they are not in health care (yet).  In health care, you’d need to be Sherlock Holmes to figure out what value is and how to know when you are getting it.  The 2% solution won’t do it.

Thursday
Oct072010

NCQA/Consumer Reports 2010 HMO Rankings

By Clive Riddle, October 7, 2010

NCQA has released its rankings of HMO and Point of Service plans around the nation for 2010, via Consumer Reports.

According to NCQA, themeasures and methodology used to rank plans did not change from 2009. Details on the methodology and guidelines are listed at http://www.ncqa.org/rankings .

Below are the top ten ranked private plans (excluding Medicaid and Medicare plans). You will note that regional and non-profit plans (vs. national for-profit) and integrated plans are well-represented.

NCQA 2010 National Ranking of HMOs: Top Ten Private Plans

  1. Harvard Pilgrim Health Care (MA, ME)
  2. Tufts Associated Health Maintenance Organization (MA, RI)
  3. Harvard Pilgrim Health Care of New England (NH)
  4. Capital Health Plan (FL)
  5. Geisinger Health Plan (PA)
  6. Grand Valley Health Plan (MI)
  7. Group Health Cooperative of South Central Wisconsin (WI)
  8. Fallon Community Health Plan (MA)
  9. Kaiser Foundation Health Plan of Colorado (CO)
  10. Health New England (MA)


Source: Consumer Reports: The 2010 rankings of HMOs from the National Committee on Quality Assurance

Source URL: http://www.consumerreports.org/health/insurance/best-health-insurance-privateRatings-1.htm

Notes: Private plans exclude Medicaid and Medicare.  This year, the NCQA ranked 227 HMOs and point-of-service plans with a total enrollment of about 42 million. Not all HMOs are on the list; some do not submit data to the NCQA, or submit insufficient data, and others decline to make it public.

Thursday
Apr222010

Health Plan “Early Adopters” for Extended Dependent Care Coverage

by Clive Riddle, April 22, 2010

The bandwagon started rolling at full steam this week for major health plans to allow applicable dependent coverage up to age 26 in advance of the September 23rd, 2010 effective date provided in The Patient Protection and Affordable Care Act.

HHS has been in communication with a number of major plans for purposes of stimulating such an initiative. On Monday, April 19th during the day, UnitedHealthcare and WellPoint issued releases regarding their new policy in this regard. HHS Secretary Kathleen Sebelius issued a statement discussing the initiative, and acknowledging the two health plans.

Monday evening Humana issued their release in this regard, and the Blue Cross Blue Shield Association issued a release on Tuesday committing the entire association of Blues plans. It’s interesting to note the WellPoint’s statement came ahead, and wasn’t coordinated with announcement of the BCBS Association policy. HHS Secretary Kathleen Sebelius issued a follow-up statement on Tuesday acknowledging Humana, the BCBS association and Kaiser Permanente. Kaiser has not issued a formal public statement in this regard, but made a general commitment to HHS and has acknowledged their position with the media.

On Wednesday the 21st, Aetna issued a statement announcing their plan to extend coverage, without providing specific details. CIGNA has not yet issued a statement. Local and regional plans (other than BCBS plans) generally have not yet issued such statements, due to the fact the initial HHS outreach was to national plans, and more to the point in a number of regions because state laws already require dependent coverage until age 26 or higher.

Regarding the varying state dependent coverage requirements, one example, as the Dayton Daily News reminds readers is that "in Ohio, that age will rise to 28 on July 1, under the provisions in the two-year budget state lawmakers approved last year." The National Conference of State Legislatures (NCSL), in a web page dedicated to the state-by-state coverage issue on this topic, provides a summary of various state initiatives to address this issue, that started all the way back in 1994, when "Utah become the first state to enact legislation allowing coverage for unmarried dependents to continue up to age 26, regardless of school enrollment status." New Jersey enacted legislation extending dependent coverage to age 31 in 2006 and the NCSL notes that now "at least 30 states have now enacted similar legislation to extend dependent coverage regardless of enrollment in school." (NCSL provides a state by state table in their web site.) The Robert Wood Johnson Foundation also provides a web site dedicated to State Coverage Initiatives that summarized Dependent Coverage provisions.

Regarding the details of the national plans extension of dependent coverage (with links to their statements):

  • UnitedHealthcare’s change is effective immediately. They state “this extension of coverage applies to college students who currently are covered under their parents' fully-insured health plan offered through UnitedHealthcare. Individual family health plans through UnitedHealthcare's Golden Rule business already allow all dependents to stay on the plan until age 26 and enrollees do not need to take any action.”
  • Humana’s change is also effective immediately, and they note “the decision by Humana directly impacts the adult children of members who are enrolled in Humana’s fully insured lines of business. (Children of members enrolled in a HumanaOne individual health plan have already been able to remain on their parents’ or guardians’ coverage until age 26.) Humana is also encouraging large employers who self-fund their coverage with Humana to extend coverage to the adult children of their employees who would otherwise lose their coverage this year.”
  • WellPoint’s policy will take effect June 1st. They state that at that time “WellPoint's affiliated health plans will automatically retain these young individuals on their parents' policies in both fully insured group and individual health plans. Our self insured clients and members will have the option of not offering this extended coverage.”
  • The BCBS Association policy is also tied to June 1st, but further equivocates that the extension is only definite for individual plans, and that they will make the option available to their employer groups, as they state “every Blue Cross and Blue Shield company has agreed to allow covered individuals under age 26 to remain on their parents' individual health insurance policies effective June 1. We will offer this extension of coverage to our employer accounts for their members.”
  • Aetna for now is at the stage where they are “working with their customers” to develop a policy: “We understand that young adults are concerned about potential gaps in health care coverage. We are working with our customers to allow young adults to remain on their parents' plan until the dependent coverage requirements of the Patient Protection and Affordable Care Act go into effect later this year. We believe this is in the best interests of our members and is in keeping with the spirit of the health reform law.”
  • Kaiser was cited in USA Today as planning “to extend coverage before September to consumers who have individual policies and is in discussions with employer groups about their policies. Details are still being worked out, ‘but our intent is to avoid an interruption in coverage for them,’ spokesman Chris Stenrud said.”
Monday
Feb082010

Membercentricity Defines Medicare Member Retention

By Lindsay Resnick, February 8, 2010

Member-centric Medicare Advantage plans have loyal, trusting customers. It’s not easy to steal a loyal member. More importantly, loyalty equals customer LifeTime Value which translates into stable membership and sustained profitability. In the Medicare market, competitive rivalry is at an all-time high, with well-orchestrated “switcher” campaigns targeting YOUR members. And, at a time when beneficiaries are seeing big changes in benefits and rates, plans seeing even the slightest uptick in voluntary disenrollment are also feeling the threat to long-term profitability.

Retaining members by creating loyal, satisfied customers has never been more important; particularly when acquiring new members is as much as 5-times the cost of keeping existing ones. Successful member retention takes proactive, personal customer service built on an attitude of MEMBERCENTRICITY. Improving customer loyalty is one of the least expensive, most impactful ways to protect membership and improve margins. Successful retention programs are based on three core principles:

  • Data Driven The more you know about your customers, who’s at risk and what’s important to them, the more members you will retain. Understanding your customer demographic and psychographic indicators helps build loyalty.
  • Continuous Interaction Frequent, personalized member outreach has huge payoff by reinforcing plan value and reaffirming a consumer’s purchase— from welcome calls to an array of “after-sale sale” communications.
  • Meaningful Messaging Create a dialogue with customers…not a monologue. Seniors are looking for guidance and interaction that’s meaningful to their situation throughout their membership lifecycle—part customer service, part sales, and part senior advocacy.


Across America, consumers have become much less forgiving of bad service. In a heartbeat, they will just take their wallet and loyalty somewhere else. A member-centric Medicare Advantage experience involves every interaction with a plan’s members?every telephone call, every email exchange, and every written communication. Make sure your plan embraces a high-touch, high-results philosophy. Retention is the ultimate measure of success in Medicare Advantage.

Friday
Nov132009

Medicare Advantage Survival Guide: Value Chain Analysis

By Lindsay R. Resnick, November 13, 2009

Many moons ago (1985 to be exact) Michael Porter’s bestselling book, Competitive Advantage: Creating and Sustaining Superior Performance, introduced the concept of value chain analysis - the chain of activities within an organization that each adds value to the final product or service. Companies were taking an introspective look at their strategic vision and tactical approach to their value chain components and markets they serve.

Fast-forward to 2009. Never has the value chain been more important to a Medicare plan than today. Regulatory pressure, competitive positioning, shifting consumer priorities, and sustainable profitable growth make a successful Medicare Advantage plan a dicey venture these days. As these plans plot a course for the future a “self assessment” may be appropriate.

Six areas of focus deserve attention —

1. Regulatory Compliance – Tracking, managing and reporting on the never-ending stream of CMS rules and regulations has never been easy for Medicare contractors. Costs associated with a Corrective Action Plan or marketing suspension are extensive in terms of financial penalties, brand deterioration, and staff distraction. Most recently, CMS has raised the bar with a set of reporting requirements for Parts C and D that incorporates hundreds of new, complex data points.

  • Does your plan have a real-time mechanism able to provide managers a “dashboard” view of critical compliance reporting across key operations or, does your compliance officer have to go “hunting and gathering” each month like a blind squirrel hunting for nuts?
  • Is your plan able to withstand the scrutiny of a CMS audit (or even a mock CMS audit) in areas such as routine documentation, policies & procedures, appeals & grievances, and fraud/waste/abuse?

2. Revenue Management – Medicare Advantage payment rates are dead center in the Obama administration’s target for cost reduction—within the next five years MA and FFS will be on a level playing field. With the pressure of shrinking payment rates survival depends on aggressive revenue management and flawless enrollment operations.

  • Does your plan have expert tools in-place to make sure you’re maximizing reimbursement through Hierarchical Condition Category (HCC) and Part C/D reconciliations on a timely and up-to-date basis?
  • What metrics are used to manage and measure your Plan’s enrollment operations to make them an integrated member management function (vs. fragmented collection of data entry staff)?

3. Medical Management – With 80% of seniors having at least one chronic health condition, the knock on Medicare Advantage has been an inability to demonstrate value of care management and improved beneficiary health outcomes. And now, with reduced reimbursement rates, there is renewed demand on plans to improve medical loss ratios to maintain profitability.

  • Is your plan linking its complex and chronic care management efforts to its HCC management?
  • Are care management tactics such as personal health assessments, medical home, and evidence-based practice guidelines part of your 2010 medical management plan?

 4. Customer Service – Competitive rivalry means your customers are another MA plan’s prospects. Customer retention now takes a mindset that combines proactive customer service with continuous “after-sale sale” tactics.

  • Is there a formal member retention program to protect your customers from competitor “switcher” campaigns, build long-term, and track retention costs…as carefully as you track acquisition costs?
  • Are operations and marketing working together to communicate with customers in a way that blends benefit education with ongoing selling of your plan’s value (i.e., an after-sale sale)?

5. Marketing Mix – Data, Data, Data…it’s at the core of every successful MA plan’s marketing mix. Customer and prospect data mining, modeling and profiling deliver tremendous competitive advantages to MA plans, from diversifying product portfolios to customer segmented messaging to new media strategies. 

  • Does your plan have ready access to accurate intelligence on your competitors’ MA, MA-PD and PDP plans, including detailed plan-by-plan benefit and enrollment information in your service areas?
  • Have you segmented your existing customers and prospects using demographic indicators combined with psychographic profiles such as lifestyle priorities, buying habits, and advertising preferences (including Internet usage)?

6. Distribution Capacity – Inappropriate marketing and sales practices are by far the biggest problem for MA plans. And, CMS is taking a hard-line approach – secret shoppers, onerous penalties for non-compliance, shutting down sales, and issuance of a glut of new rules. At the same time, organic membership growth gets tougher and tougher. The ability for a plan to deploy multiple distribution channels is separating winners from losers.

  • Are your field sales agents (in-house and outside brokers) fully trained, credentialed, certified, and monitored to make absolutely certain you’re limiting exposure to CMS marketing and sales rule violations?
  • Have you moved away from a single source distribution strategy to maximize a multi-outlet sales approach: complementary field agent channels, telesales and Web?

This self review is a quick start to figuring out if your plan is where it needs to be in today’s tumultuous Medicare marketplace. If answers are hard to come by or, if there’s little internal agreement, it’s an important sign—don’t wait. Your plan needs a deeper dive into those areas that are coming up short. Organize a dedicated effort to attack problem areas, utilize outside experts well-versed in the “ins & outs” of Medicare Advantage, and take corrective action. Most importantly, do it sooner rather than later.

Thursday
Sep172009

Health Plan Coverage of H1N1 Virus Administration Varies

by Clive Riddle, September 17, 2009

Earlier this week, the FDA announced approval of four vaccines against the H1N1 virus. As we await the expected spread of the H1N1 virus this fall, health plans around the country are announcing their policy regarding coverage. Of course, the H1N1 vaccine itself is being covered by the government, once it becomes available. So the coverage issue is with respect to payment to providers for their administration of the shot.

Is it a no-brainer that health plans will provide coverage for administration of the H1N1 virus? It is as long as their specific plan of benefits cover immunizations. But typically, health plans offer a wide menu of benefit plans, including some that do not provide immunization coverage.

However, some health plans have announced they will take the extra step to provide administration coverage for all their members, even those whose benefit plans do not offer immunization coverage. Such health plans are taking the public health policy approach that by removing barriers to the vaccine, they are doing their part to reduce the potential spread of the virus, which should provide the indirect benefit of reduced overall incidence and corresponding cost of treatment for their member population as well.

A survey of recent health plan coverage announcements indicates health plans uniformly will cover H1N1 administration costs for member benefit plans that cover immunizations, but are split on providing H1N1 administration coverage when their benefit plans do not cover vaccines.

Those who will provide administration coverage to all members include:

  • Likewise, Independence Blue Cross in Pennsylvania issued a release that they will provide coverage of H1N1 vaccine administration including for members whose benefit plans exclude immunization coverage

Those who will limit administration coverage to members with vaccine coverage benefits include:


  • WellPoint some time ago announced they will provide H1N1 vaccine administration coverage only for members with benefit plans covering vaccines.
  • Aetna sent notices to providers that they will provide H1N1 vaccine administration coverage only for members with benefit plans covering vaccines.


The AAFP news yesterday published a story providing details on how physicians should code and bill major health plans and Medicare  for H1N1 administration fees. Interestingly, there is not a standard approach for coding by the health plans. The administration fee cannot exceed the regional Medicare vaccine administration fee.

Tuesday
Sep012009

U.S. Uninsured Total Hits 180 Million (if you include dogs and cats)

by Clive Riddle, September 2, 2009

Who knew that September was North American Pet Health Insurance Awareness Month? Not I, until I visited the North American Pet Health Insurance Association web site and discovered their press release. The association informs us that “about 60% of U.S. households have at least one dog, cat, bird, or other companion animal. Many have more than one….. Projected 2009 pet expenditures for North America are over $45 billion, of which $25 billion will be spent on veterinary medicine.”

Now inspired that the calendar had indeed turned to September, and that there was only 29 days left of North American Pet Health Insurance Awareness Month,  I dug deeper. I came across the article Pet Insurance Shows Promising Market Growth, from InsuranceNewsNet, Inc., which informs us:

  • “The U.S. pet insurance market recorded 107 percent increase in total growth from 2003 through 2007”
  • “It is estimated that there are more than 70 million pet cats and 68 million pet dogs in the country but only 1 to 4 percent of pets are covered by health insurance.”
  • “The cost of pet insurance also varies greatly. Accident-only coverage may cost as little as $9.50 while fuller benefits above $60 but typically the cost is about $30 to $50 a month.”

So doing the math, if there are 138 million pet cats and dogs, and we assume 3% are insured and 97% are uninsured, we have approximately 134 million uninsured Fidos and Tiggers. Add this to the 46 million two-legged uninsureds, and the health care reform debate is re-framed. What’s more, there is a huge market opportunity if anyone can get the owners of these 134 million pets to pony up and buy some insurance.

The plans represented by the North American Pet Health Insurance Association certainly think the opportunity exists. Participating plans include:

And now health insurance giant Aetna has been bitten by the pet insurance bug. Right on the Aetna Home Page, under the "Find the Right Plan" section, resides a link "For Pet Insurance" in which Aetna proclaims “We have offered insurance products to help our members for more than 150 years. Now we can help you with pet health coverage for your cat or dog, too.”

Aetna inked a deal at the end of last year to underwrite Pets Best. This July Aetna and Pets Best announced a program to “provide 50,000 local businesses and 79 working Chambers of Commerce in Connecticut and Western Massachusetts access to discounted rates on pet insurance plans.”

Gretchen Spann, Aetna’s very own Head of Pet Insurance tells us “in these difficult economic times, many people are having difficulty keeping up with the rising cost of veterinary services. Some people might find that the predictability of a monthly premium helps them budget for the care their dog or cat might need in the future.”

Thursday
Aug202009

Health Co-ops: Checking out Group Health Cooperative

by Clive Riddle, August 20, 2009

Health Care Cooperatives are certainly getting more than 15 minutes of fame as the health reform debate intensifies. Group Health Cooperative has been perhaps the most visible and referenced example referenced in discussions from all sides. For the less initiated, what follows is a quick overview of all things GHC. Group Health Cooperative is based in Seattle, Washington, with almost 10,000 employees and serves around 550,000 members in twenty Washington counties and two counties in Northern Idaho.

Governance

As a cooperative, GHC arranges the delivery of health care benefits and services for its members as a non-profit, member controlled organization. Unlike the traditional structure of a member-owned cooperative, financial surpluses are reinvested and not distributed to the members.

Group Health is governed by an 11-person Board of Trustees of volunteer consumer members, which hires the chief executive officer and makes major policy decisions. Any member of GHC eighteen years or older is eligible to vote to elect the Board of Trustees, and to vote on bylaw changes. The GHC bylaws are available for review online. Members must register to vote, and the registration deadline just passed (August 18th) to vote at the 2009 annual membership meeting (Oct. 17th 2009.)

Public Board meetings begin with an open microphone session during which any GHC can address the Board directly on all matters except those related to personal health care. Some GHC medical centers also have volunteer-led Medical Center Advisory Councils that work with staff to address care and wellness issues and meet at least four times per year. The councils are open to GHC members who reside near or receive care at a respective medical center.

GHC’s President and CEO is Scott Armstrong, who has been with the organization since 1986, starting as an assistant hospital administrator. He became president and CEO in January 2005. Prior to GHC he was the assistant vice president for hospital operations at Miami Valley Hospital in Dayton, Ohio.

Provider Network

GHC care is delivered by Group Health Permanente providers (880+ physicians) at Group Health-operated medical facilities, and in outlying areas and through POS options, also through a network of almost 9,000 providers and 40+ hospitals. After five decades serving as a staff model, the physicians formed Group Health Permanente, an independent professional corporation, in 1997, which operates under exclusive contract to serve GHC. 

History and Growth

In 1946, GHC, known as Group Health Cooperative of Puget Sound, was developed, acquired a Seattle medical clinic and hospital and starting with 1947 established a group practice, prepaid health plan. Initial coverage costs involved a $100 membership fee, plus $3 per month dues for each adult family member and $1.50 per month per child up tot four, with no charge for additional children. The local King County Medical Society undertook a highly organized campaign against GHC physicians and their members, resulting in a lawsuit and 1951 State Supreme Court unanimous ruling against the anticompetitive practices of the Medical Society.

Membership by the end of the 1950’s came close to 40,000. Enrollment surpassed 100,000 in 1967. Additional medical centers were developed and service area expanded each decade. In 1977 11,000 member Tacoma's Sound Health Association was acquired, and by 1979, enrollment surpassed 275,000. In 1982, the first agreement was signed to provide care by non-Group Health physicians on Vashon and Maury islands.  In 1983, enrollment surpassed 300,000 and GHC established the Group Health Center for Health Studies; the Center for Health Promotion; and Group Health Foundation., and acquired an existing Spokane 20,000 member health plan serving Eastern Washington, which evolved by 1987 into the affiliate Group Health Northwest, consolidating services east of the Cascades. In 1990, GHC launched Group Health Options, Inc., a subsidiary, which offered the Northwest's first POS plan. In 1994, Group Health membership passed 500,000. By the late 1990s membership approached 700,000.

In 1997, a strategic alliance was formed with Kaiser Permanente’s Washington operations, creating Kaiser/Group Health, a new non-profit corporation set up to oversee Group Health Cooperative, Group Health Northwest, and Kaiser Permanente Northwest.However, at the same time, GHC deficits began mounting, and GHC began cutting back in participation in various programs and markets, causing enrollment to begin shrinking down to its current level (550,000.). Kaiser and GHC agreed to dramatically scale back their affiliation to a more simple reciprocity of provider services agreement. GHC experienced a financial turnaround at the start of the new millennium. In 2005, GHC acquired KPS Health Plan, a 62-year-old nonprofit plan based in Bremerton, WA.

Additional historical information is available at HisotryLink.org and in the GHC web site.

Current Financials

GHC yielded $2.8 billion in revenue in 2008, up from $2.6 billion in 2007, with operating expenses of $2.7 billion in 2008 and $2.6 billion in 2007. External provider network expenses (non GHC owned facilities or Group Health Permanente) comprised 50% of operating expenses. 2007 yielded a $71 million surplus primarily due to $57 million in investment income, while 2008 yielded a $9 million loss, primarily due to $60 million in investment losses. In August 2009 Standard&Poor's Ratings Services “lowered its counterparty credit, financial strength, and senior secured debt ratings on Group Health Cooperative (GHC) to 'BBB+' from 'A-'. The outlook on the counterparty credit and financial strength ratings is negative. The rating action is based on GHC's downward revision to its 2009 earnings forecast. The company is now expecting a pretax operating loss.”

Accolades

A recent Commonwealth Fund case study notes that Group Health Cooperative is structured with incentives aligned "to launch innovations and organize services in ways that make the most sense operationally and clinically." The case study highlighted attributes contributing to the organization’s success:

  • Information Continuity  with EHR
  •  Care Coordination and Transitions and System Accountability, including medical homes and case management
  • Peer Review and Teamwork for High-Value Care, including clinical dashboards and P4P
  • Continuous Innovation
  • Easy Access to Appropriate Care, including same day appointments for urgent care, after hours urgent care and telephonic nurse advise linked to HER, direct specialist access, group visits and electronic visits

GHC touts that it has the "Highest Member Satisfaction among Commercial Health Plans in the Northwest Region" ranking by J.D. Power and Associates;

"Excellent" accreditation rating from the National Committee for Quality Assurance (NCQA) for the seventh year in a row; "America's Best Health Plans" rating by U.S. News & World Report and NCQA; and Highest ranked for health plan quality and prescription drug plan quality by the Centers for Medicare and Medicaid Services (CMS) Medicare Plan Comparisons.

Doubts about GHC as a nationwide model

But for all the success, these doubts have publicly surfaced regarding how realistic it would be to duplicate GHC as a nationwide model for health reform:

  1. As a recent New York Times article questions, is the governance aspect of a cooperative, as advanced by many reformers, the successful attribute of GHC, or is it the integrated delivery system, which is present in non-cooperative based programs such as Kaiser?

  2. Considering the infrastructure required to operate the GHC mixed delivery model that at its core is an integrated group practice, is it realistic to develop something similar from scratch for new markets in any reasonable time frame?

  3. Considering GHC’s financial position is no stronger, and perhaps weaker than other major health plans around the country, what are the financial dangers in replicating their model?